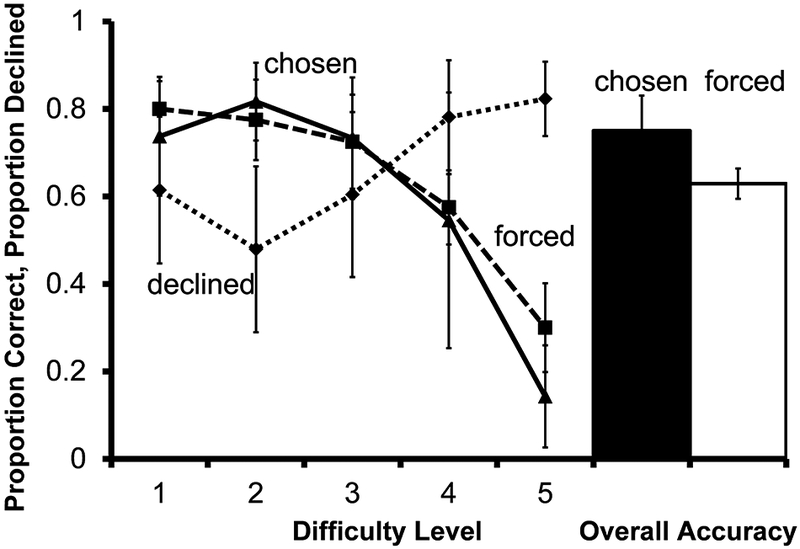
Fig. 12.

Performance of 6 monkeys on the prospective metamemory transfer test in Experiment 6. Solid and dashed lines indicate accuracy on chosen and forced tests according to difficulty level. The dotted line indicates proportion of choice trials for which the decline-test response was used. The filled bar represents overall accuracy on all trials the monkeys chose to take. The unfilled bar represents overall accuracy on all trials the monkeys were forced to take. Error bars represent ±1 SEM
