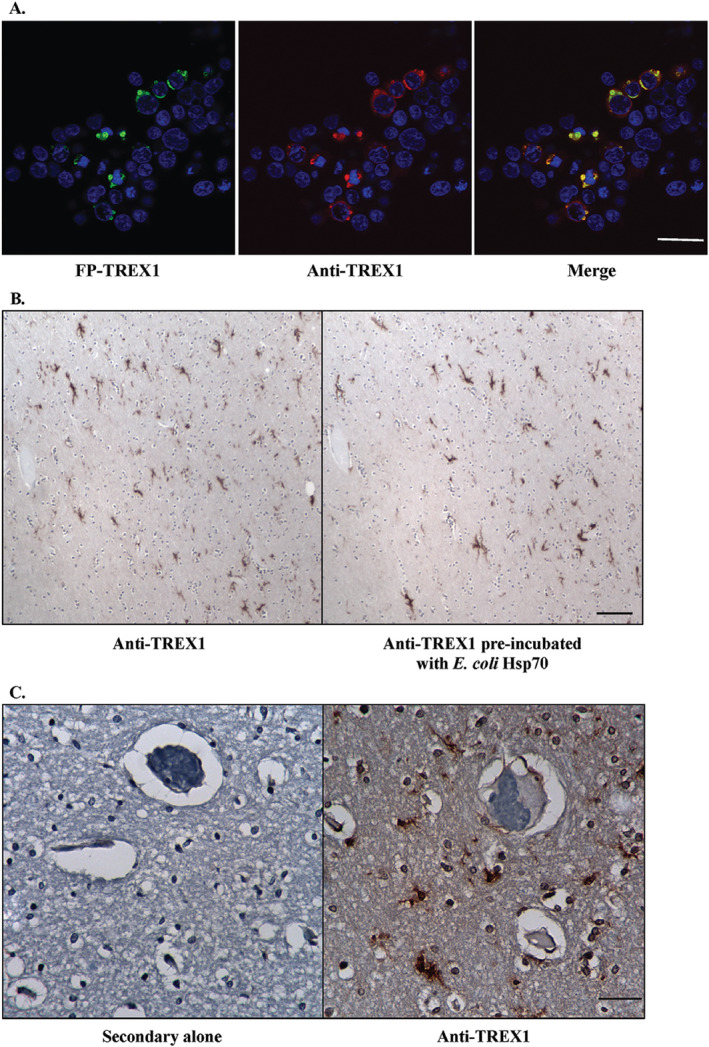
Figure 3.

Specificity of rabbit pAb to TREX1. A. Immunofluorescent staining of 293T cells transfected with fluorescent protein‐tagged wild‐type TREX1 (FP‐TREX, green) using the rabbit pAb to TREX1 (red) shows that the signals overlap (yellow). Scale bar represents 28 μm. B. Immunohistochemical staining of human brain tissue with rabbit pAb to TREX1 alone (left panel) and after pre‐incubation of the Ab with E. coli heat shock protein 70 (Hsp70, right panel). Scale bar represents 100 μm. C. Immunohistochemical staining of human brain tissue with secondary Ab alone (left panel) or rabbit pAb to TREX1 (right panel). Scale bar represents 40 μm.
