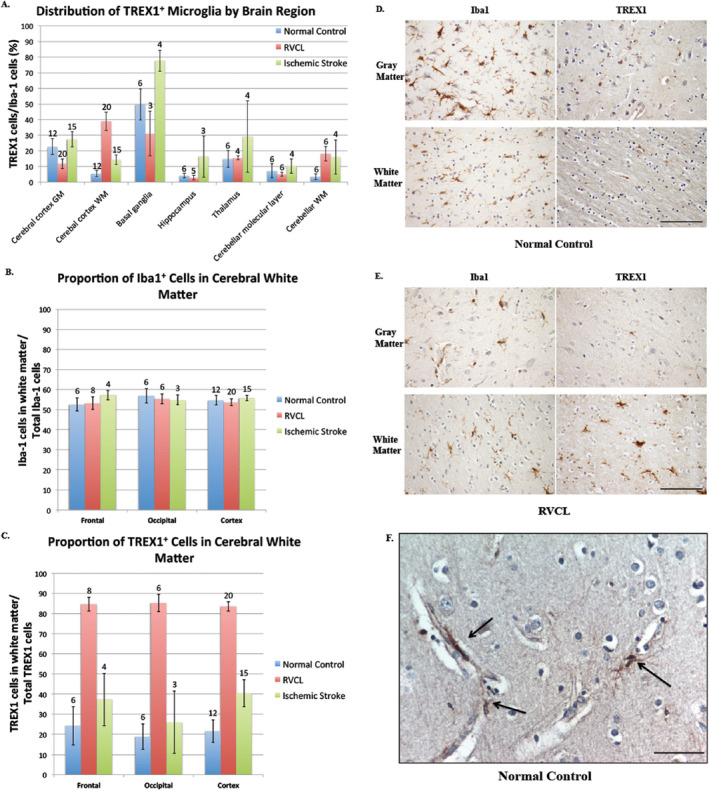
Figure 5.

Distribution of TREX1 expressing cells. A. Distribution of TREX1+ microglia by brain regions in normal controls and cases of RVCL and ischemic stroke. The proportion of TREX1 cells is shown relative to the mean number of microglia (Iba1 stained cells) for specific areas of the brain in normal controls (blue bars) and cases with RVCL (red bars) or ischemic stroke (green bars). Sections quantified in RVCL and ischemic stroke were taken from undamaged tissue. The number of tissue sections included for each observation is noted above the appropriate column. White matter (WM); Gray matter (GM). Data are presented as mean ± SEM. B‐C. Distribution of TREX1 and Iba1 staining in the cerebral cortex of normal controls and cases of RVCL and ischemic stroke. The proportion of Iba1 (E) or TREX1 (F) cells located in the white matter for the frontal lobe, occipital lobe and the cerebral cortex in normal controls (blue bars) and cases with RVCL (red bars) or ischemic stroke (green bars). The values represent the mean among each group for cell counts in the white matter divided by the total cell counts in the white and gray matter for the specified region. Sections quantified in RVCL and ischemic stroke were taken from undamaged tissue. The cerebral cortex includes sections from the frontal, parietal, temporal and occipital lobes. The number of tissue sections included for each observation is noted above each column. Data are presented as mean ± SEM. D‐E. Immunohistochemical staining of a normal control and subject with RVCL with Iba1 (left panels) and TREX1 (right panels) in the gray (top panels) and white matter (bottom panels). For RVCL, undamaged brain tissue is shown. Staining for Iba1 and TREX1 is developed with DAB (brown). Nuclei are counterstained with hematoxylin (blue). Scale bars represent 100 μm. F. Representative immunohistochemical staining of normal control gray matter with TREX1 microglia (DAB, brown) in association with microvasculature (arrows). Nuclei are counterstained with hematoxylin (blue). Scale bar represents 40 μm.
