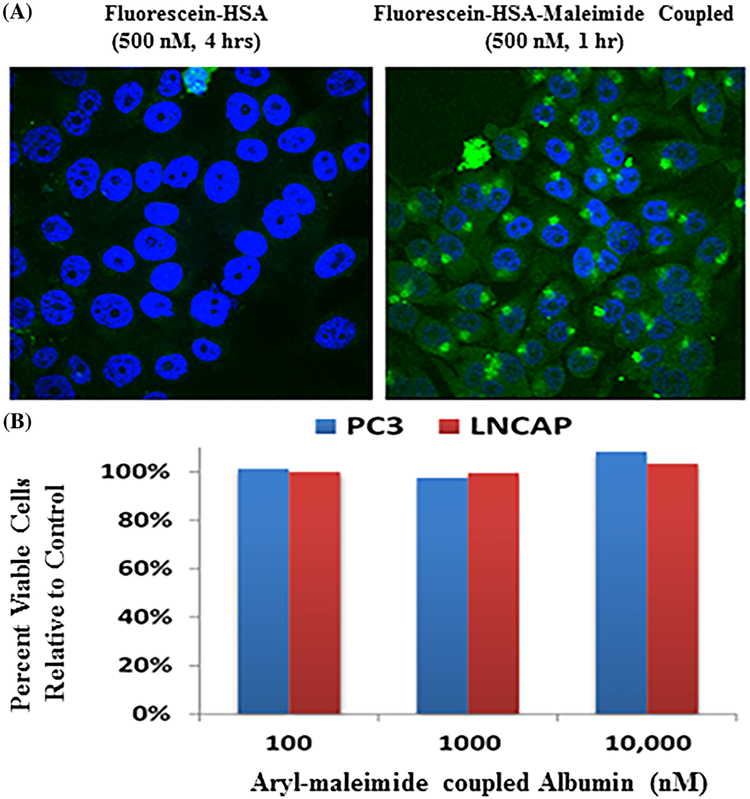
FIGURE 5.
A, Differential uptake by PC-3 human prostate cancer cells of 500nM FITC-HSA at 4 h vs 500 nM FITC-HSA-maleimide at 1 h. Blue fluorescence is due to DAPI staining of DNA and Green fluorescence is due to fluorescein-HSA-maleimide uptake. B, Dose-Response of LNCaP and PC-3 human prostate cancer cells to 5 day of fluorescein-HSA-maleimide as evaluate percent viability compared to untreated control cells.

