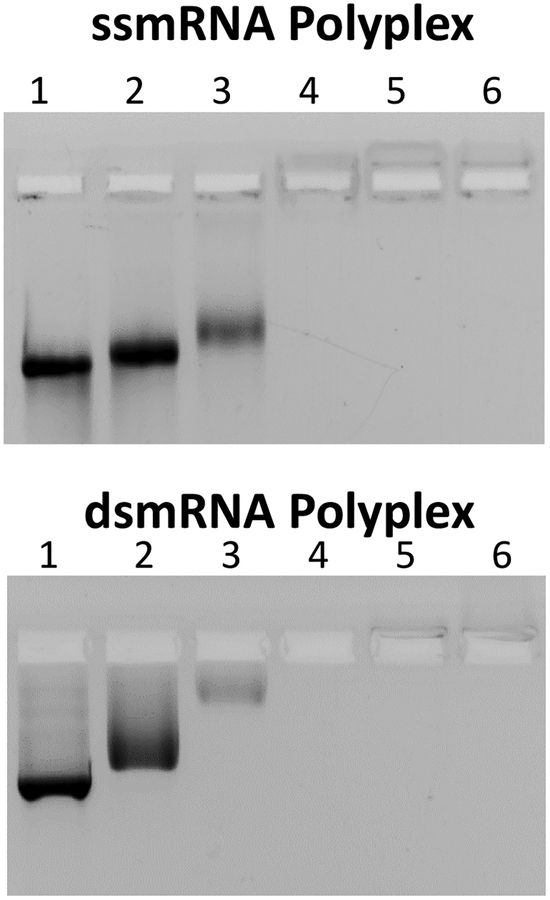
Figure 2. Agarose Gel Electrophoresis Band Shift of ssmRNA and dsmRNA PEG-peptide Polyplexes.
Panel A and B illustrate the band shift for ssmRNA (0.5 μg) and dsmRNA1 (0.5 μg) respectively, when combined with 0, 20, 50, 100, 400, or 800 pmol (lanes 1-6) of PEG-peptide and electrophoresed on a 1% agarose gel detected by ethidium bromide.

