Figure 4.
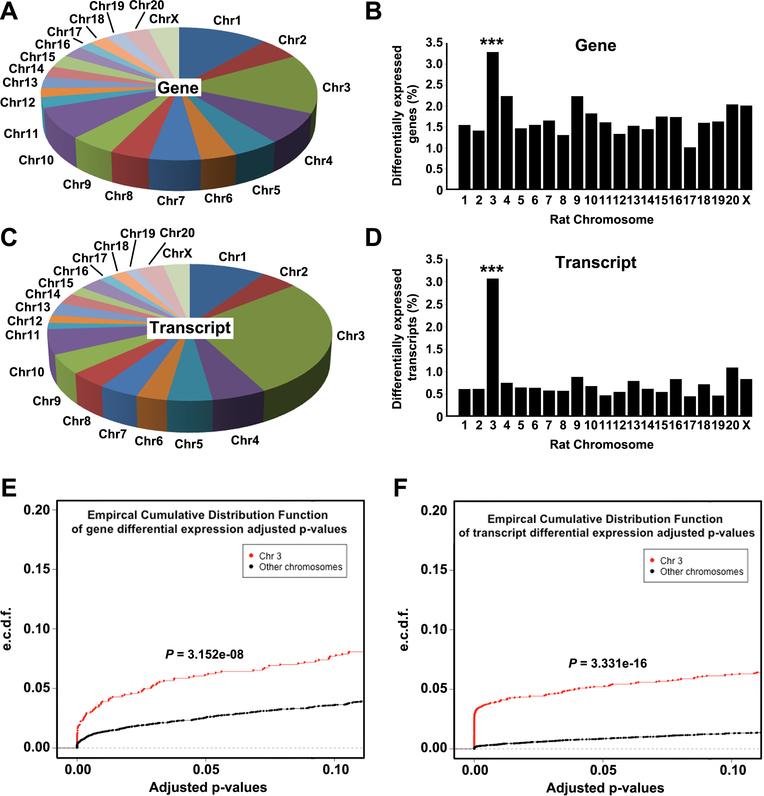
Localization of differentially expressed genes and transcripts in the TME of SS.BN3IL2Rγ (n=4) and SSIL2Rγ (n=4) rats, as determined by SSRS. (A) Chromosomal distribution of the 541 differentially expressed genes in the TME of SS.BN3IL2Rγ rats compared with the SSIL2Rγ. (B) Differentially expressed genes from panel (A) presented as differentially expressed genes per chromosome normalized to total number of genes per chromosome. (C) Chromosomal distribution of the 489 differentially expressed transcript isoforms in the TME of SS.BN3IL2Rγ rats compared with the SSIL2Rγ. (D) Differentially expressed transcript isoforms from panel (C) presented as differentially expressed transcript isoforms per chromosome normalized to total number of transcript isoforms per chromosome. ***P<0.001, as determined by Fisher’s exact test. Distributions of adjusted p-values for differentially expressed genes (E) and differentially expressed transcripts (F) on RNO3 versus the rest of the rat genome were tested by a two-sample Kolmogorov-Smirnov test.

