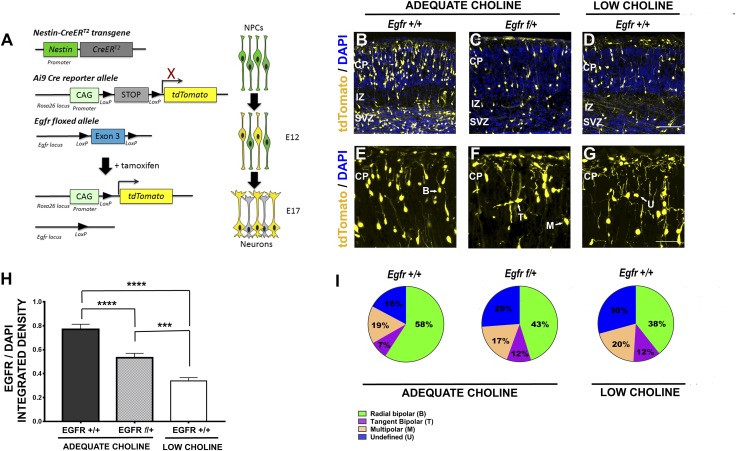
Figure 2.
Egfr haploinsufficiency in Egfr f/+-Nestin-CreERT2+/−-Ai9+/− cortical NPCs, as well as LC availability during gestation, disrupt cortical neurogenesis in embryonic day (ED) 17 embryos. A) TM-induced recombination in the Ai9 allele, leading to expression of tdTomato in NPCs and their progeny and deletion of the floxed 3d exon of Egfr (Egfr f/+). B) Expression of tdTomato, induced in AC Egfr+/+-Nestin-CreERT2+/−-Ai9+/− embryos at ED 12 and analyzed at ED 17, demonstrated mosaic labeling of cells within the VZ/SVZ and pyramidal neurons migrating to the CP; the IZ is also shown. C) Compared to AC Egfr+/+-Nestin-CreERT2+/−-Ai9+/− littermates, tdTomato-labeled cells in AC Egfr f/+-Nestin-CreERT2+/−-Ai9+/− cortices are reduced in number in the VZ/SVZ and the CP. D) Fewer tdTomato cells in the VZ/SVZ and the CP are also observed in the cortices of LC ED 17 embryos when tdTomato expression is induced at ED 12. E) Most of the labeled pyramidal neurons in the CP of AC Egfr f/+-Nestin-CreERT2+/−-Ai9+/− embryos exhibit bipolar morphology, with clearly defined processes. F) Pyramidal neurons in the CP of Egfr f/+-Nestin-CreERT2+/−-Ai9+/− embryos appear disorganized, with some cells exhibiting multiple processes. G) Neurons in the CP of LC ED 17 embryos, in which tdTomato expression was activated at ED 12, also exhibit abnormal morphology, with many neurons appearing multipolar and round (undefined). H) Quantification of EGFR protein levels was performed in control Egfr+/+-Nestin-CreERT2-Ai9+/− and Egfr+/−-Nestin-CreERT2-Ai9+/− tdTomato-expressing NPCs by detection of immunofluorescence (n = 4–6 embryos per group). ***P < 0.001 by Student’s t test. I) Venn diagrams depicting distribution of labeled neurons in the CP of AC Egfr+/+-Nestin-CreERT2+/−-Ai9+/−, Egfr f/+-Nestin-CreERT2+/−-Ai9+/− and LC ED 17 embryos demonstrate reduction in the proportions of cells with bipolar morphology (green) and increase in cells with undefined morphology (blue) in Egfr f/+-Nestin-CreERT2+/−-Ai9+/− and LC embryos compared to AC embryos. ***P < 0.001, ****P < 0.0001, by 1-way ANOVA. B, bipolar; M, multipolar; T, migrating tangentially; U, undefined. Scale bars: 100 μm (D); (G): 60 μm.

