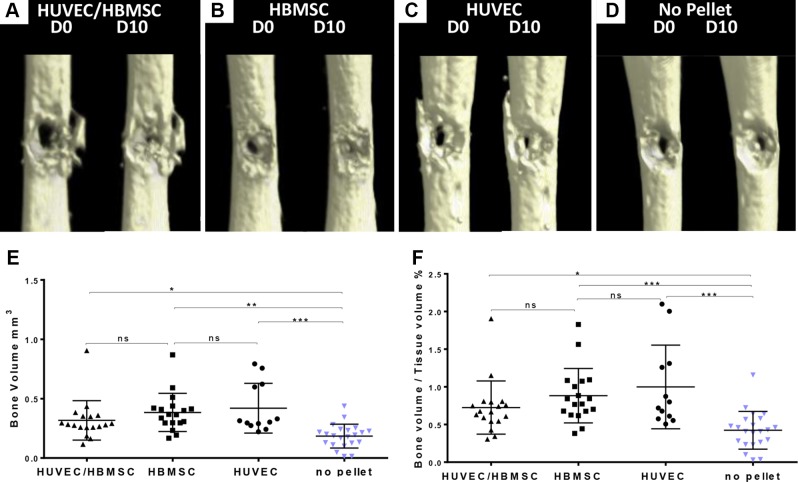
Figure 4.
µCT scan images of representative femur defects at d 0 and 10, and statistical analysis. A) Coculture pellet (HUVECs/HBMSCs). B) HBMSC pellet. C) HUVEC pellet. D) No pellet. E, F) µCT data analysis of increase in BV (E) and BV/TV ratio (F) change at d 10 in femur defects with cell pellet implant compared with sham control. All treatment groups demonstrated a significant change in bone parameters. No-pellet femurs constituted sham controls. HUVEC pellets, n = 12; HBMSC pellets, n = 18; HUVEC/HBMSC pellets, n = 18; no pellet, n = 22. All data presented as mean ± sd. *P ≤ 0.05, **P ≤ 0.01, ***P ≤ 0.001.

