Figure 4.
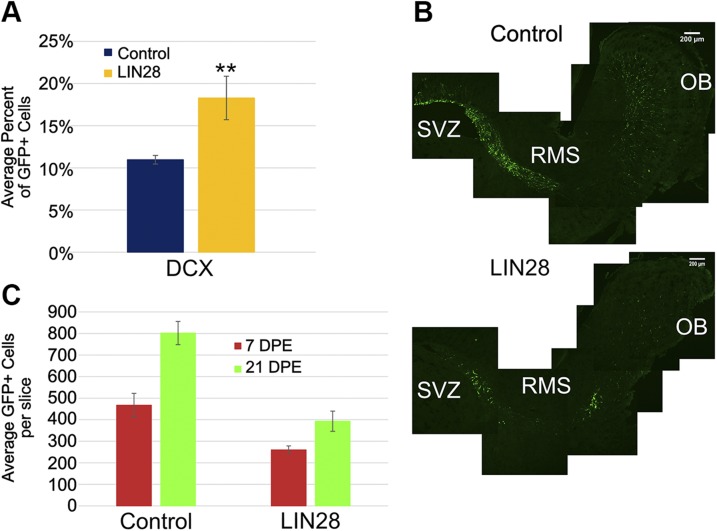
LIN28 increases the NB population in the SVZ at 3 DPE. A) Bar graph showing the average percent of GFP+ cells positive for DCX, a marker for NBs, at 3 DPE; n = 7 slices (control), n = 6 slices (LIN28::GFP). B) Representative ×10 sagittal micrographs showing the GFP+ cells (green) in the SVZ, RMS, and OB for control (upper) and LIN28 (lower) at 7 DPE. Original scale bars, 200 μM. C) Bar graph displaying the average total GFP+ cells at 7 and 21 DPE. Data (21 DPE) were presented earlier in Fig. 2; n = 11 slices (control), n = 7 slices (LIN28::GFP). A, C) Data are presented as means ± sem. **P ≤ 0.001 vs. control, Student’s t test.

