Figure 6.
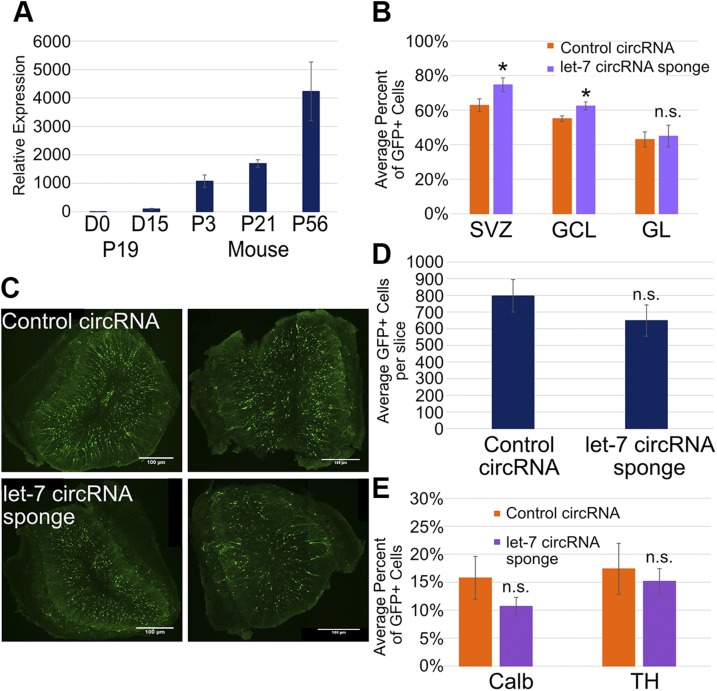
Relative levels of mature let-7 increase over time. let-7 has a minor effect on cell fate and total neurons in the OB at 21 DPE. A) Bar graph showing that relative levels of let-7g in the OB determined use of real-time PCR, normalized to the endogenous control snoRNA202. P, postnatal. P19 cells were used as a positive (d 15) and negative (d 0) control; n = 4 mice at each time point. B) Bar graph depicting the average percent of GFP+ cells expressing tdTomato at 21 DPE in the SVZ and the GCL and GL of the OB; n = 6 slices (control), n = 4 slices (LIN28::GFP). C) Representative ×10 micrographs displaying total GFP+ cells (green) in the OB of control circRNA (upper left and right) and let-7 circRNA sponge (lower left and right) at 21 DPE. Original scale bars, 100 μM. D) Bar graph showing the average total GFP+ neurons in each OB slice at 21 DPE; n = 7 slices (control), n = 7 slices (LIN28::GFP). E) The average percent of GFP+ cells positive for Calb or TH at 21 DPE; n = 5 slices (control), n = 7 slices (LIN28::GFP). A, B, D, E) Data are presented as means ± sem. *P ≤ 0.05 vs. control, Student’s t test.

