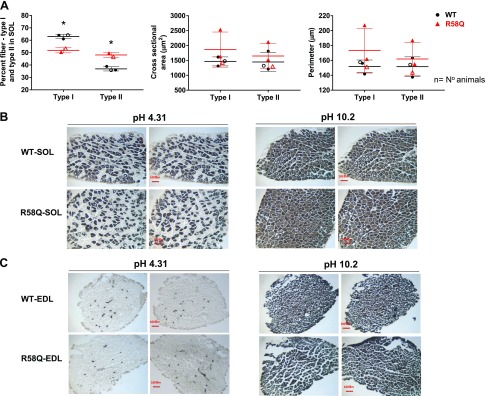
Figure 4.
Myosin ATPase staining of SOL and EDL muscles from R58Q and WT mice. A) Proportion of fiber type I to type II and cell size in SOL muscles of WT (black) and R58Q (red) mice. Each data point represents the average ± sd (2–3 animals/group). Points originate from quantification of 13–15 slides per animal. *P < 0.05 (1-way ANOVA). B, C) Representative images of cross-sections of SOL (B) or EDL (C) muscles stained at pH 4.31 (left panels) and 10.20 (right panels). At pH = 4.31, fiber type I exhibits dark-gray staining vs. very light gray–stained fiber type II. At pH 10.20, the opposite is true, and fiber type I staining is represented by gray color, whereas fiber type II is represented by dark gray.

