Figure 1.
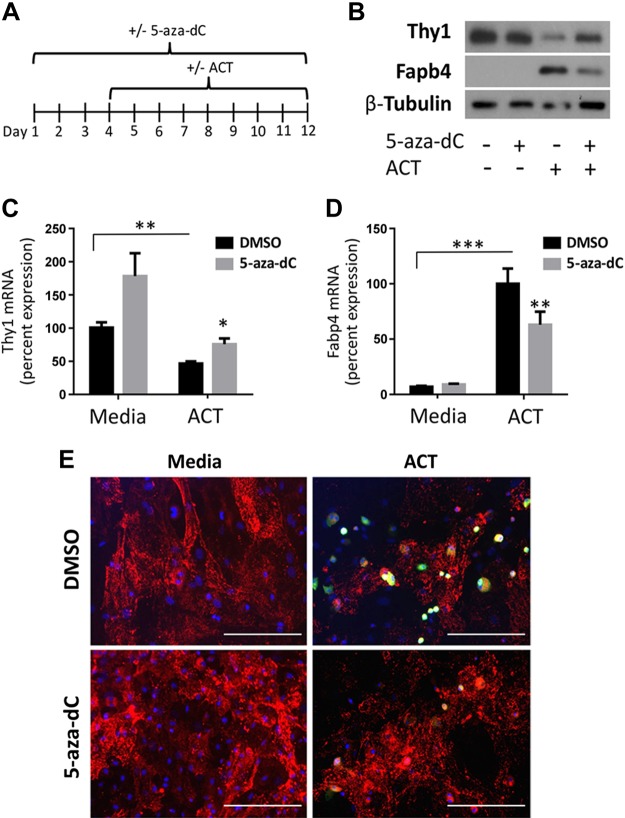
The reduction of Thy1 expression during adipogenesis is attenuated by 5-aza-dC in mMSCs. mMSCs were treated daily with either DMSO or 5-aza-dC for 12 d continually with basal medium alone or with the introduction of the ACT starting at d 3. A) Timeline diagram of treatment for mMSCs. B) Western blot shows treatment with 5-aza-dC increases Thy1 protein levels and decreases protein levels of the adipogenic marker Fabp4 vs. cells only receiving the ACT. C, D) Quantitative real-time PCR results show that treatment with 5-aza-dC significantly increased Thy1 mRNA and decreased Fabp4 mRNA levels. Relative percentages were normalized to medium DMSO for Thy1 mRNA and to ACT DMSO for Fabp4 mRNA levels. E) Immunofluorescent images depict reduced FAPB4 (green) and increased Thy1 (red) expression in cells receiving 5-aza-dC vs. those receiving ACT alone. Cell nuclei are stained with DAPI and are depicted in blue. Scale bars, 200 μm. *P < 0.05, **P < 0.01, ***P < 0.001.

