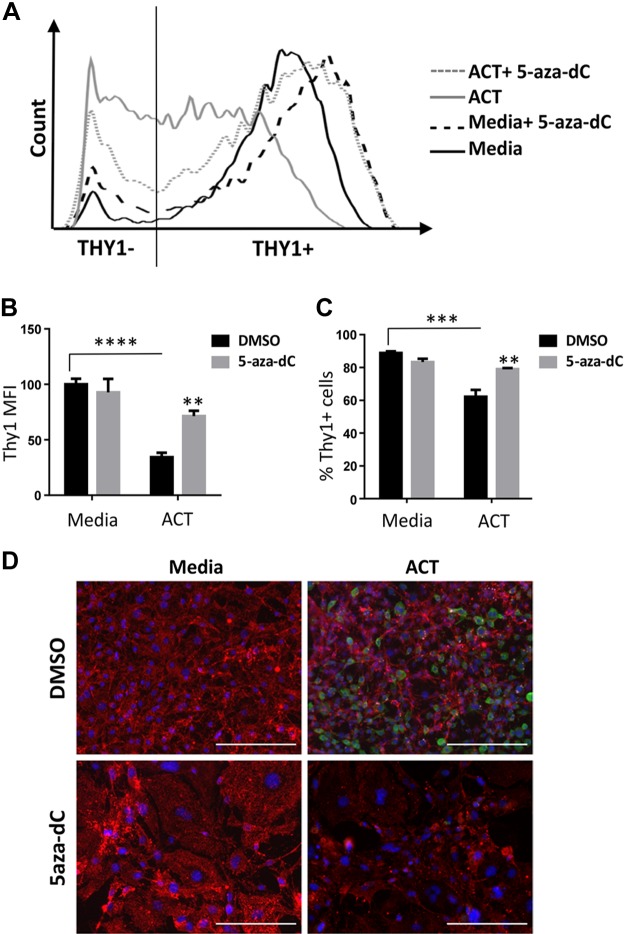
Figure 3.
Thy1 surface protein levels attenuated by 5-aza-dC. 3T3-L1 cells were treated daily with either DMSO or 5-aza-dC for 7 d with the introduction of the ACT starting at d 3. A) Representative histogram of Thy1 surface levels measured by flow cytometry using a CD90.2-PE conjugated antibody. B) ACT samples had a decrease in Thy1 MFI, which was partially attenuated by 5-aza-dC treatment. C) ACT samples had a decrease in Thy1+ cells compared with medium alone, whereas ACT cells treated with 5-aza-dC had an increase in the Thy1+ population. D) Immunofluorescent images show decreased staining of Thy1 (red) with ACT compared with preadipocytes (medium alone) and increased Fabp4 (green). Thy1 staining was sustained when ACT samples were treated with 5-aza-dC, along with decreased staining by Fabp4. Cell nuclei were stained with DAPI and are depicted in blue. Scale bars, 200 μm. **P < 0.01, ***P < 0.001, ****P < 0.0001.

