Figure 3.
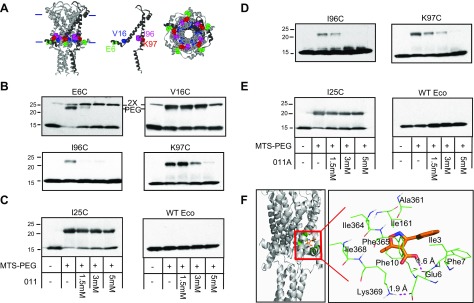
Compounds 011 and 011A block the binding of MTS-PEG5000 to specific cysteine mutants in a dose-dependent manner. A) The Eco MscL structure from molecular modeling, based on the Mycobacterium tuberculosis MscL crystal structure, is shown in a side view (left), with the approximate location of the bilayer indicated with horizontal bars; a single subunit is darkened for clarity. The location of the affected cysteine mutants is shown in a single subunit (middle) with residues E6 in green, V16 in blue, I96 in magenta, and K97 in red. A view from the cytoplasmic side (right) is also shown. B) Western blot analysis of MscL cysteine mutants after MTS-PEG5000 vs. compound 011 competition assay. The absence (−) or presence (+) of 50 μM MTS-PEG5000 (MTS-PEG), as well as the absence or different concentration of compound 011 used, are indicated in the table at the bottom of C. Top band: protein that has been PEGylated; this band disappears as the concentration of 011 is increased (1.5–5 mM). Both E6 and V16 dimmers can be seen slightly higher than the PEGylated protein band (PEG) (n = 3–7). Original magnification, ×2. C) Negative controls for compound 011: Eco-MscL with a mutation near the pore, I25C, shows a PEGylated band that is not inhibited or shifted by compound 011 (left), and WT Eco-MscL, which does not have any naturally occurring cysteine, shows no upper band with MTS-PEG5000 (right; n = 2). D) Western blot analysis after MTS-PEG5000 vs. compound 011A competition assay. The absence (−) or presence (+) of 50 μM MTS-PEG5000 (MTS-PEG) and the absence (−) or different concentration of compound 011A used, are indicated in the table at the bottom of E. Top band: protein that has been PEGylated; this band disappears as the concentration of 011A is increased (1.5–5 mM) (n = 3–5). E) Negative controls for compound 011A are shown: Eco-MscL I25C, shows a PEGylated band that is not inhibited or by compound 011A (left), and WT Eco-MscL, shows no top band with MTS-PEG5000 (right; n = 2). F) Docking site for 011A using Glide software. The position within the complex is shown on the left, and a close-up showing relative position to residues E6, F10, and K97 (K369 = K97, subunit 3).

