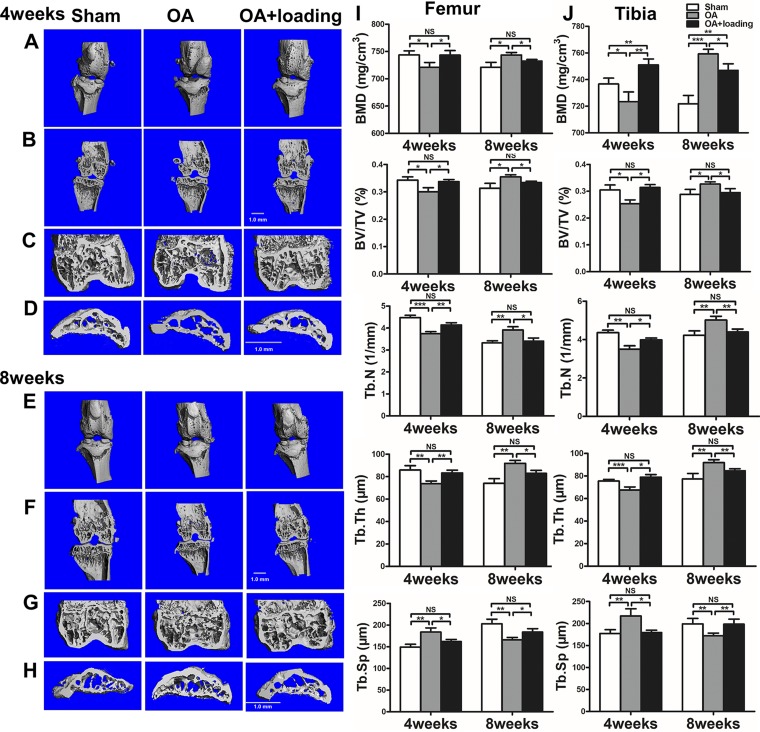
Figure 6.
Knee loading prevents abnormal bone remodeling. A, B, E, F) Representative 3-dimensional images (A, E) and 2-dimensional images (B, F) of knee joint. C, D, G, H) Two-dimensional images of distal femur (C, G) and proximal tibia subchondral bone (D, H). Quantitative analysis of BMD (mg/cm3), BV/TV (%), Tb.N (1/mm), Tb.Th, and Tb.Sp (μm) in femur (I) and in tibia (J) (n = 3/group). *P < 0.05, **P < 0.01, ***P < 0.001, P > 0.05. N.s., not significant.

