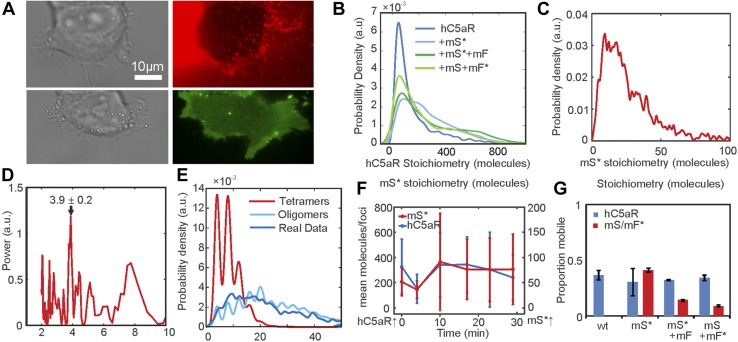
Figure 3.
Single-molecule TIRF microscopy of hC5aR, LukS, and LukF in live cells. A) Images of HEK cells treated with LukSK281CY113H (mS) and Alexa Fluor-labeled LukFK288C (mF*) showing brightfield (left), hC5aR-mGFP (green), and mF* (red). B–D) Probability distribution for stoichiometry of hC5aR in the absence and presence of Alexa Fluor mS* and mF* (B), and of mS* foci (C), indicating tetramer periodicity (D) from Fourier spectral analysis. E) A random tetramer overlap model cannot account for mS* experimental stoichiometry data (R2 < 0), but a tetramer-multimer model results in excellent agreement (R2 = 0.85). F) hC5aR and mS* stoichiometry as a function of incubation time. G) Proportion of immobile and mobile colocalized foci in the presence and absence of mS and mF. Error bars show sem from n = 5–15 image subregions (n = 20–30 cells,∼1000–10,000 foci).

