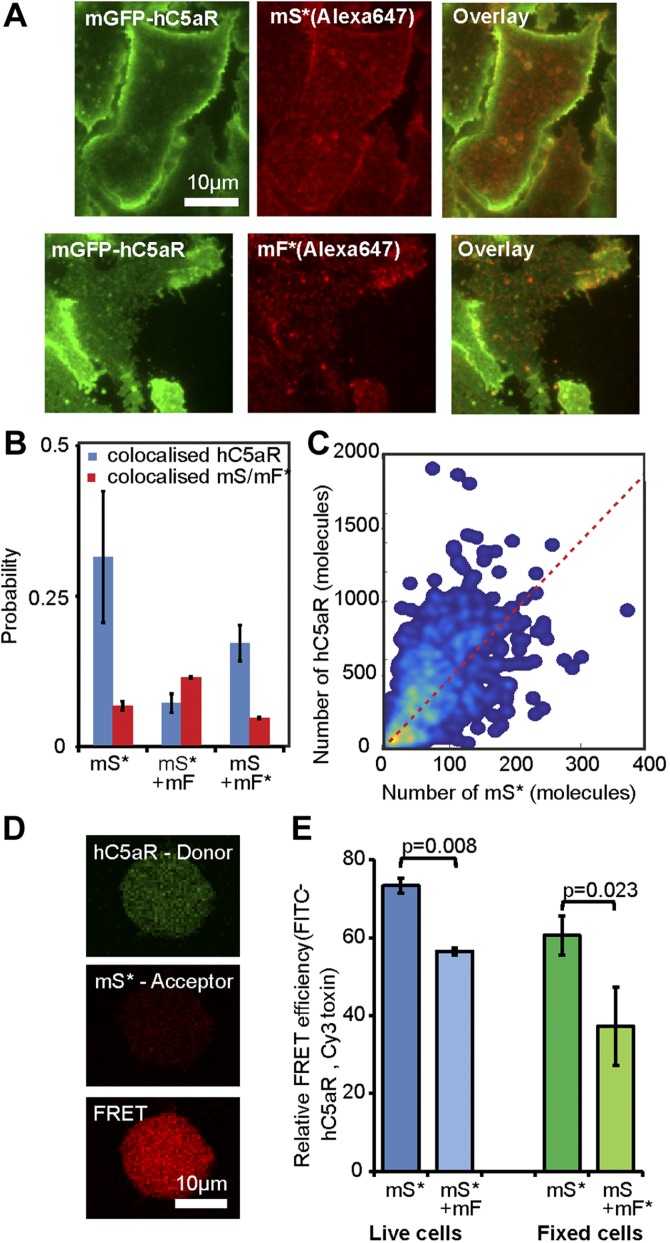
Figure 4.
Relative stoichiometry of hC5aR, LukS, and LukF in fixed cells. A) Micrographs of fixed hC5aR-mGFP HEK cells treated with LukSK281CY113H (mS) and LukFK288C (mF) showing hC5aR-mGFP (left), Alexa Fluor 647 (Aöexa647, middle), and merge (right) on Alexa Fluor mS* with zoom-in (lower panels) showing colocalized foci. B) Proportion of colocalized foci treated with mS, mS* + mF, and mS + mF* for hC5aR. Error bars show sem from n = 4 image subregions (n ∼ 1000 foci). C) Heatmap of correlation between hC5aR and mS stoichiometry (red, dashed line indicates 4 mS per hC5aR molecule); R2 ∼ 0.15 (n ∼ 1000 foci from ∼ 10 cells). D, E) FRET images and efficiencies. The FRET experiment was performed in live and fixed sortase-tagged FITC-hC5aR-expressing cells. Live cells (number of biologic replicates, n = 2) were incubated in the presence of Cy3 mS* for 1 h at +4°C and washed, after which, unlabeled mF was added. FRET was analyzed before (mS*) or after (mS* + mF) addition of mF. FRET from fixed cells (n = 3) was analyzed in the presence of mS* or unlabeled mS and Cy3 mF* (n = 2). Statistical significance between cells with only mS and both of the toxin components, mS and mF, was analyzed using Student’s t test. Error bars indicate sd.

