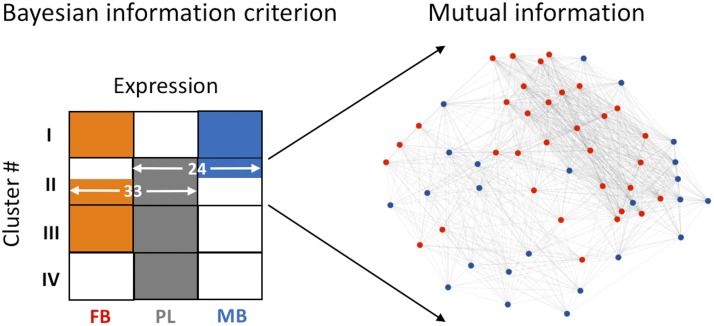
Figure 3.
Model-based clustering of DE genes. The 4 predicted expression clusters are shown relative to gene expression patterns in the MB, FB, and placenta (PL). The color-coded boxes (orange for FB, gray for PL, and blue for MB) represent genes that are expressed in the respective sample (white box indicates that the genes are either not expressed or low in abundance in that sample). Within cluster II, 33 genes were expressed in the FB and the placenta but not in the MB, whereas the other 24 genes were expressed in the MB and the placenta but not in the FB. MI-based network analysis reveals that these genes interact among each other.

