Figure 3.
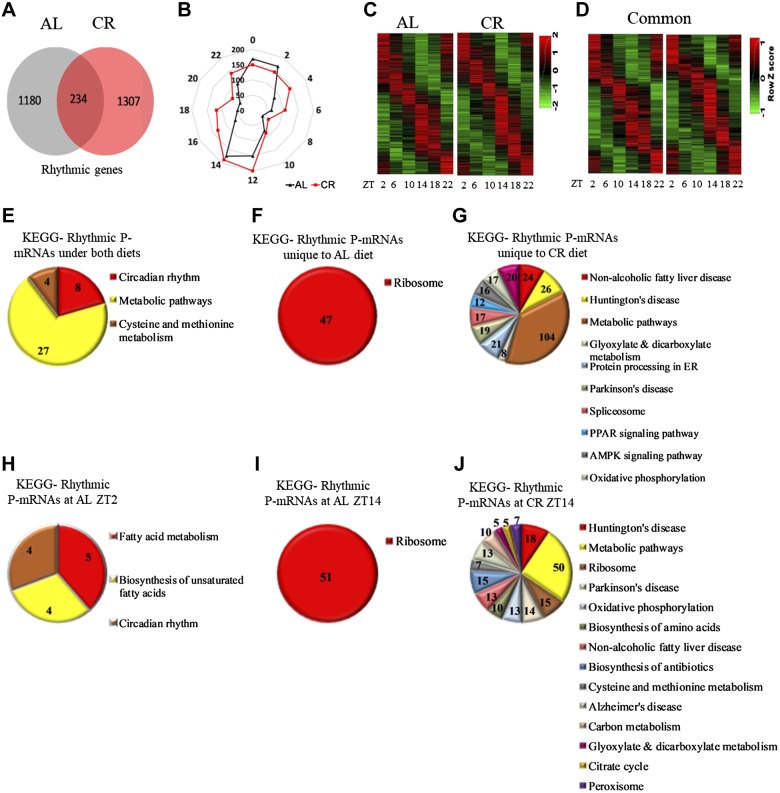
Rhythms in the abundance of P-mRNA in the liver of mice under AL and CR diets. A) The number of transcripts found to be circadian in the liver polysomes of AL and CR animals by JTK_cycle analysis. Cutoff value was set at P < 0.05. B) Radar diagram for the distribution pattern of circadian P-mRNAs in the liver polysomes of AL and CR animals. The numbers at the periphery of radar (0–22) represent time of the day (light is on at ZT0, and off at ZT12). The numbers on the circle represent number of P-mRNAs whose abundance peaked at that time of the day. C) Heatmap for P-mRNA abundance and distribution of circadian P-mRNAs in the liver polysomes of AL and CR animals. D) Heat map displays the peak in P-mRNA abundance and distribution of circadian transcripts rhythmic under both AL and CR diets. E) Enriched pathways for P-mRNAs rhythmic under both AL and CR diets. F) Enriched pathways for P-mRNAs rhythmic only in the liver polysomes of AL animals. G) The enriched pathways for P-mRNAs rhythmic only in the liver polysomes of CR animals. H) The enriched pathways for rhythmic P-mRNAs peaked at ZT2 in the livers of AL animals. I) Enriched pathways for rhythmic P-mRNAs peaked at ZT14 in livers of the AL animals. J) Enriched pathways for rhythmic P-mRNAs peaked at ZT14 for CR animals. Pathways are sorted in decreasing order of significance. Values on the pie chart represent transcripts involved in the pathways. Cutoff value was set at P < 0.01.

