Figure 7.
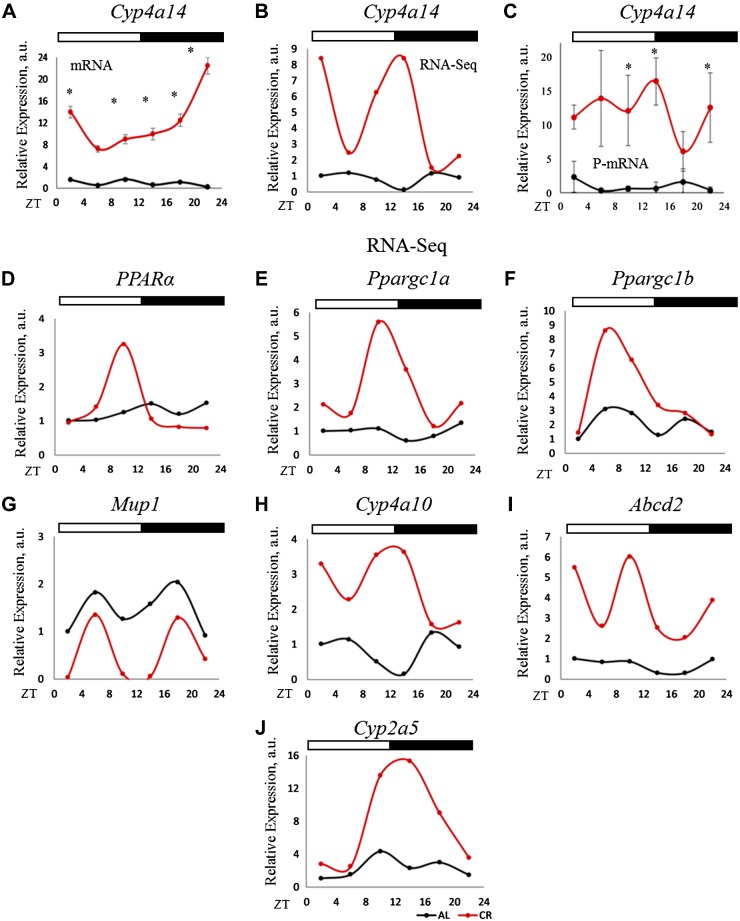
P-mRNA and mRNA abundance for Cyp4a14, a PPARα-target gene. A) mRNA abundance for Cyp4a14 in the total RNA from the liver of CR and AL animals (n = 3 for each time point for each diet). B) mRNA-seq data for P-mRNA of Cyp4a14, a target of PPARα transcription factor, in the liver polysomes of CR and AL animals (n = 2 for every time point for each diet). C) Validation of mRNA-seq data of Cyp4a14 P-mRNA (n = 3 for every time point for each diet). The 18S gene was used as control for total RNA, whereas β-actin was used for P-mRNA expression analysis. Two-way ANOVA was performed using GraphPad Prism, and a value of P < 0.05 was considered significant. D) P-mRNA of PPARα in the liver polysomes of AL and CR and animals. E–J) P-mRNA of PPARα target genes in the liver polysomes of AL and CR and animals. Two biologic replicates for each time point of AL animals were compared to that of CR for differential P-mRNA abundance using Deseq2 software. Log2 values for the fold change thus obtained were used to plot graphs (n = 2 for each time point for each diet). Light/dark bars at the top represents light and dark phases of the day (light on at ZT0 and off at ZT12). *P < 0.05.

