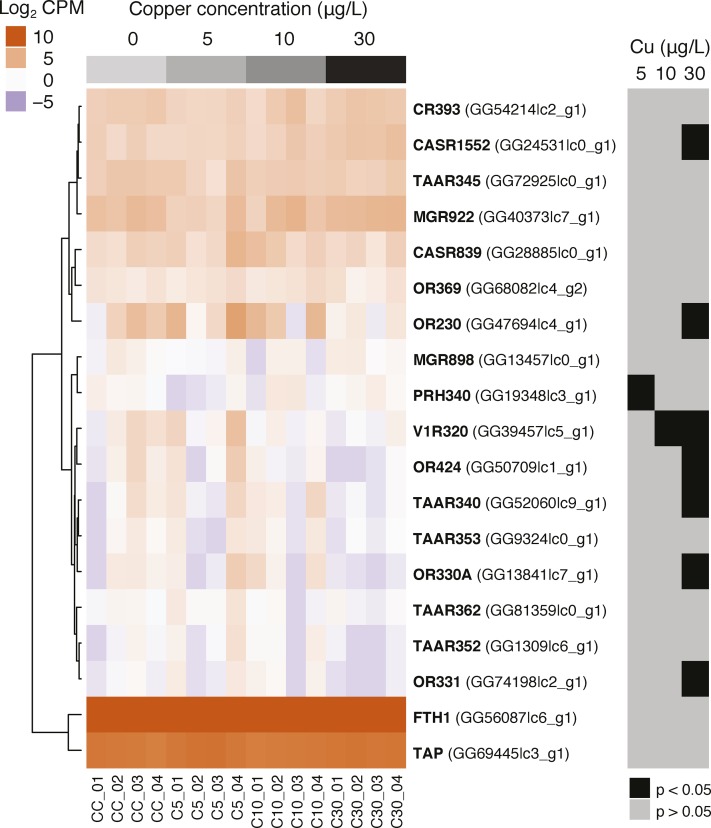
Figure 3.
Transcript concentration (Log2 counts per million transcripts [CPM]) for 19 candidate genes in the olfactory tissue of lamprey exposed to increasing doses of copper. Statistical significance of differences for each gene x treatment comparison indicated by gray and black boxes to the right.

