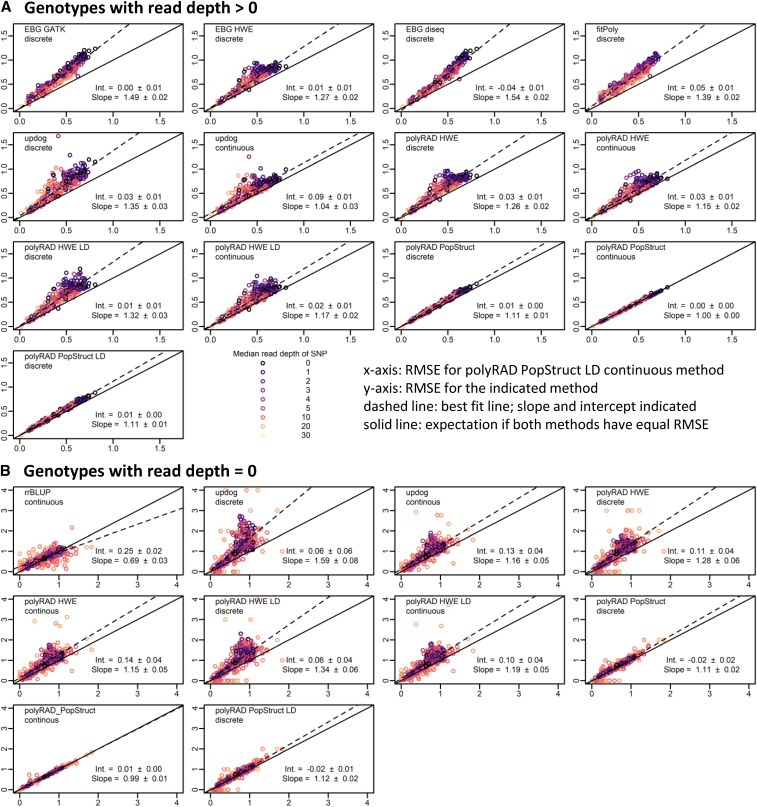
Figure 3.
Genotyping error of EBG, fitPoly, updog, polyRAD, and rrBLUP in a simulated tetraploid diversity panel derived from genotypes of 565 diploid Miscanthus sinensis. The benefits of incorporating population structure into the genotyping model and using continuous rather than discrete genotypes are illustrated. Genotypes were coded on a scale of 0 to 4. Root mean squared error (RMSE) was calculated between actual genotypes and genotypes ascertained from simulated RAD-seq reads at 395 SNP markers (lower RMSE = higher accuracy). Each point represents one SNP. Median read depth is indicated by color, including genotypes with zero reads. The RMSE for continuous genotypes output by the polyRAD PopStruct LD method is shown on the x-axis, and the RMSE of other methods and types of genotypes (continuous or discrete) is shown on the y-axis. The dashed line indicates the ordinary least-squares regression with slope and intercept estimates, with standard errors. The “norm” model was used with updog. (A) RMSE calculated using only genotypes with more than zero reads. (B) RMSE calculated using only genotypes with zero reads, by genotyping or imputation method and genotype type. LinkImpute was not included given that it works for diploids only.

