Figure 3.
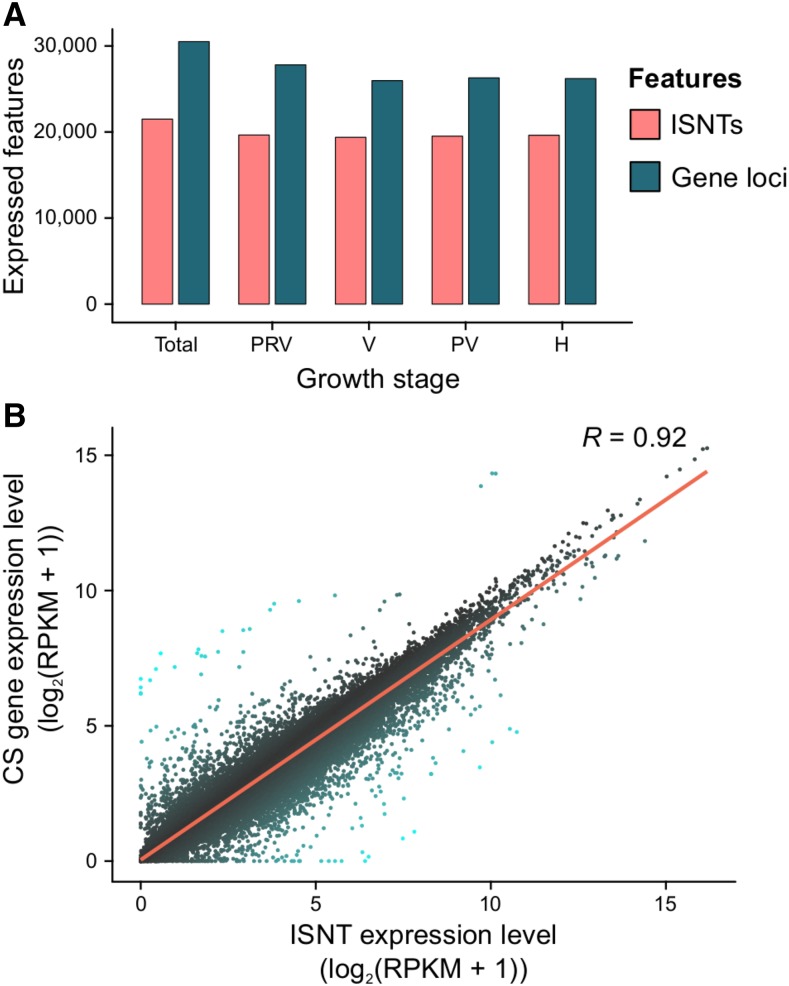
Gene expression analysis during berry development using the ISNT as reference and comparison with the Cabernet Sauvignon genome. (A) Number of ISNT transcripts (ISNTs) and gene loci expressed overall and at each ripening stage. Abbreviation of berry growth stages: PRV, Pre-véraison; V, Véraison; PV, Post- véraison; H, harvest. (B) Scatterplot showing the correlation between the gene expression level (log2(RPKM + 1)) of ISNT isoforms and Cabernet Sauvignon (CS) gene loci. Line of best fit and correlation coefficient factor (R) are provided.

