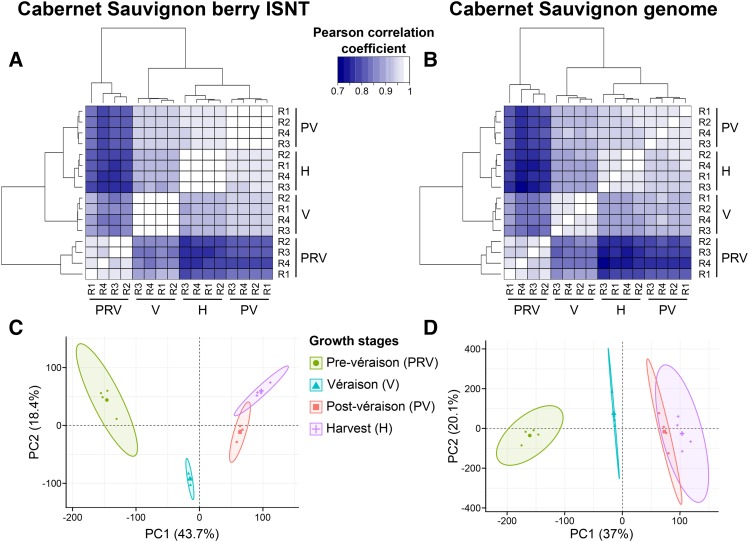
Figure 4.
Global transcriptomic changes during berry development ripening using the ISNT and Cabernet Sauvignon gene space as references. (A, B) Pearson correlation matrices of the 16 berry transcriptomes. (C, D) PCA plots of the 16 berry transcriptomes. Each point represents a biological replicate and ellipses define confidence areas (95%) for each berry growth stage. All analyses were performed using the log2-transformed RPKM values of expressed features (mean RPKM ≥ 1 at least at one stage).

