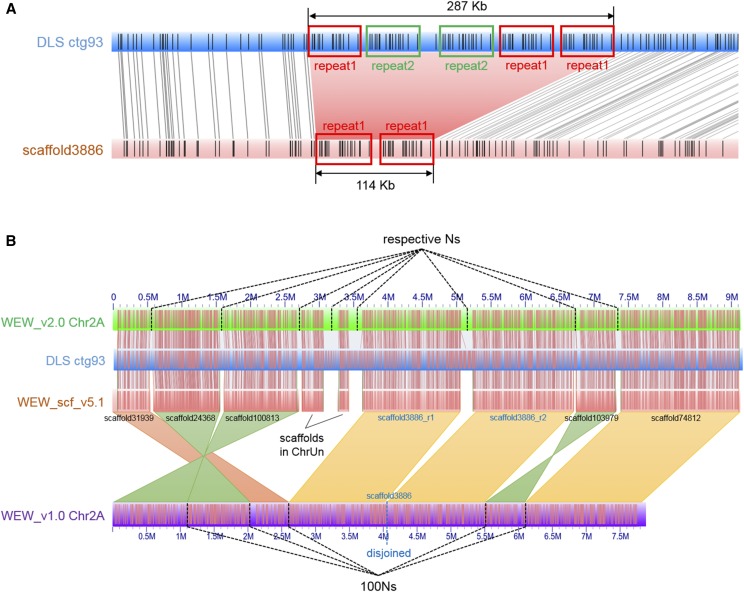
Figure 2.
Detection of chimeras and reconstruction of pseudomolecules. (A) Discrepancy (pink shade) between scaffold3886 (pink rectangle) and DLS ctg93 (blue rectangle). Three copies of repeat 1 (red boxed) and two copies of repeat 2 (green boxed) were in tandem in an ∼287 kb region in DLS ctg93, but only two copies of repeat 1 were present in the ∼114 Kb region in scaffold3886, which was then disjoined into two scaffolds. (B) Illustration of pseudomolecule reconstruction. For a portion of the Chr2A (green rectangle) in the WEW_v2.0, 9 scaffolds of WEW_scf_v5.1 (pink rectangle) were ordered and oriented with the aid of DLS ctg93 (blue rectangle). In comparison, the portion in WEW_v2.0 is 9.1 Mb, whereas 7.9 Mb in the WEW_v1.0 (purple rectangle); three scaffolds (scaffold24368, scaffold100813, and scaffold103979) were re-oriented (green shades); three scaffolds (scaffold31939, scaffold24368, and scaffold100813) were re-ordered; scaffold3886 showed a discrepancy compared to DLS ctg93 (blue rectangle) and was disjoined (see detail in A); and two scaffolds of a total length of 490 kb in ChrUn of the WEW_v1.0 assembly were anchored onto Chr2A based on their alignments on DLS ctg93. The scaffolds in WEW_v1.0 were linked with 100 Ns, while they were linked with the number of Ns estimated with the optical maps in WEW_v2.0.

