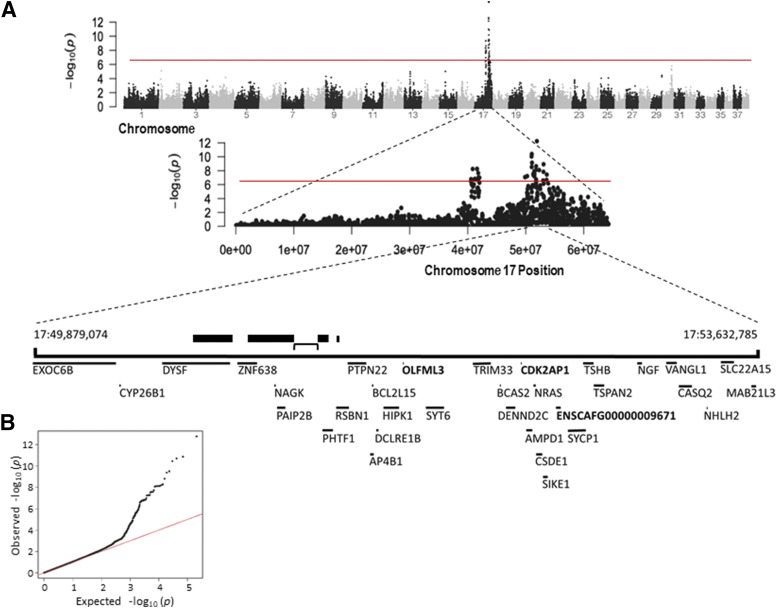
Figure 1.
Genome wide association with severe goniodysgenesis and glaucoma A. Manhattan plot for the canine genome; chromosome 17 is shown in more detail and genes in the region are shown below. Thick bars show known large structural variants and the bracket indicates the location of the break in synteny between dog and other mammals. Red line shows the Bonferroni significance level (4.8 × 10⁻⁷). Genes in bold are those where a coding sequence variant was detected. B. QQ-plot for the GWAS analysis. The lambda value is 1.07.

