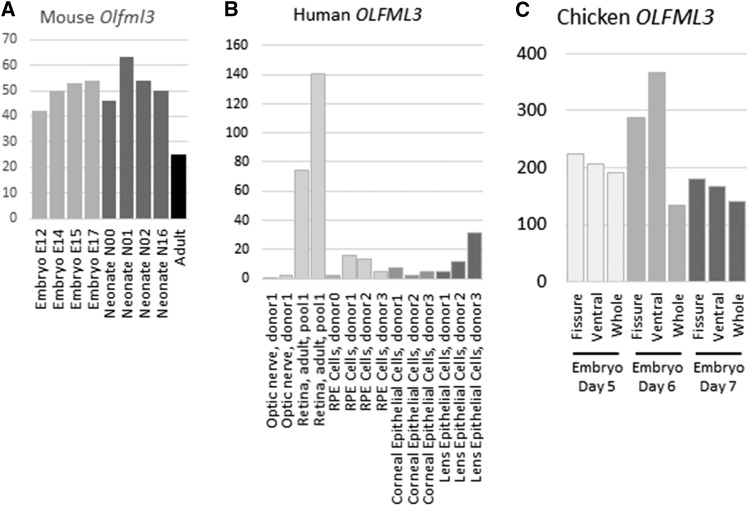
Figure 4.
Expression of OLFML3 genes in eye regions A. Expression of Olfml3 in developing mouse eyeball. Results are based on CAGE and were downloaded from the FANTOM5 database (http://fantom.gsc.riken.jp/5/tet). Y axix shows RLE normalized values. Light gray – embryonic samples; dark gray – neonatal samples; black – adult sample. B. Expression of OLFML3 in human eye tissues and cells. Results are based on CAGE and were downloaded from the FANTOM5 database. Y axis shows RLE normalized values. Light gray – optic nerve and retina; mid gray – cornea; dark gray – lens. C. Expression of OLFML3 in the developing chick eye. Results are based on RNA sequencing (J. Rainger et al., unpublished data). Y axis shows transcripts per million (TPM) values. Light gray – embryonic day 5; mid gray – embryonic day 6; dark gray – embryonic day 7.

