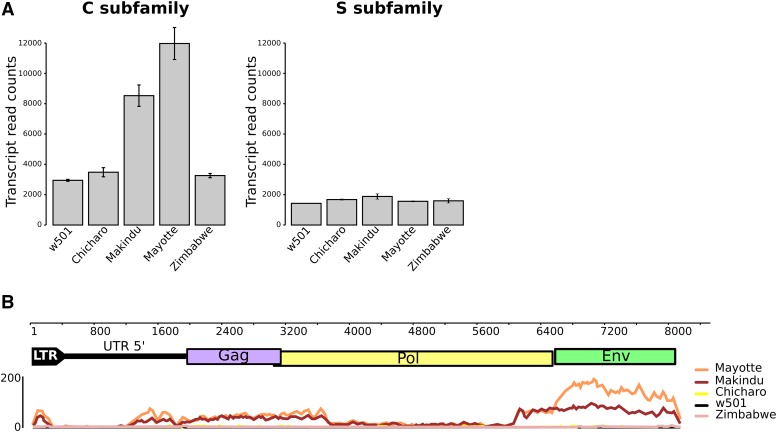
Figure 1.
Tirant trancripts analyzed from RNA-seq data. A. Tirant transcript normalized read counts. B. Mapping of tirant reads against the reference tirant copy (subfamily C). The upper part is tirant structure, to scale (in bp). The lower part is read coverage along tirant sequence, obtained from samples of 25,000,000 paired-end reads. We removed LTR 3′ to get rid of multi-mapping issues.

