
Fig. 2.
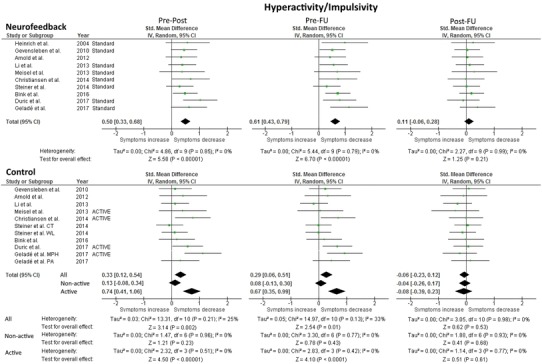
Forest Plot of within-group analysis for hyperactivity/impulsivity parameter. Total standardized mean difference (SMD) with 95% confidence interval, overall effect, and heterogeneity are reported. Analysis of the control condition separately for non-active and active controls was conducted for comparability to the inattention parameter analysis. Pre-Post refers to the difference in means at pre- and post-measurement, and similarly for pre-FU and post-FU