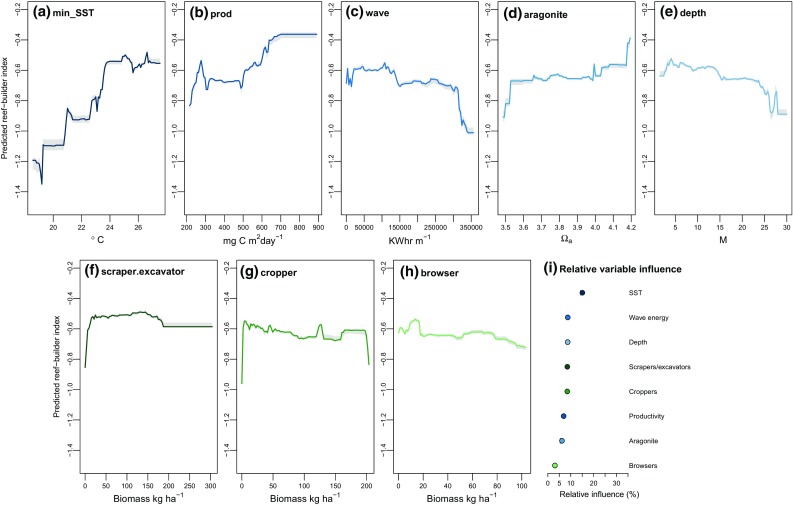
Fig. 2.

Partial dependence plots and relative importance values for each covariate. Partial dependence plots show predicted change in reef-builder index values along the range of each abiotic covariate (a–e) and biotic grazing covariate (f–h), with relative importance values (i). Fitted lines are predicted reef-builder index values across the range of each selected covariate, holding all other covariates to their mean and with data deciles indicating the distribution of original observations. Red dashed lines are smoothed LOESS functions, and shaded areas are 95% uncertainty envelopes generated from bootstrapped model predictions
