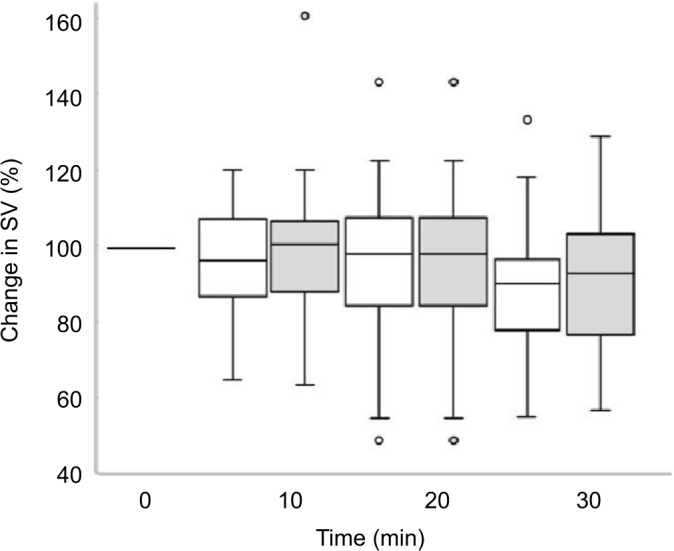
Figure 2.

Change of SV in the MD and LD groups at 10, 20, and 30 minutes after SA.
Notes: Baseline values are represented as 100%, white boxes represent MD, gray boxes represent LD, and the dots represent outliers.
Abbreviations: LD, low dose; MD, medium dose; SA, spinal anesthesia; SV, stroke volume.
