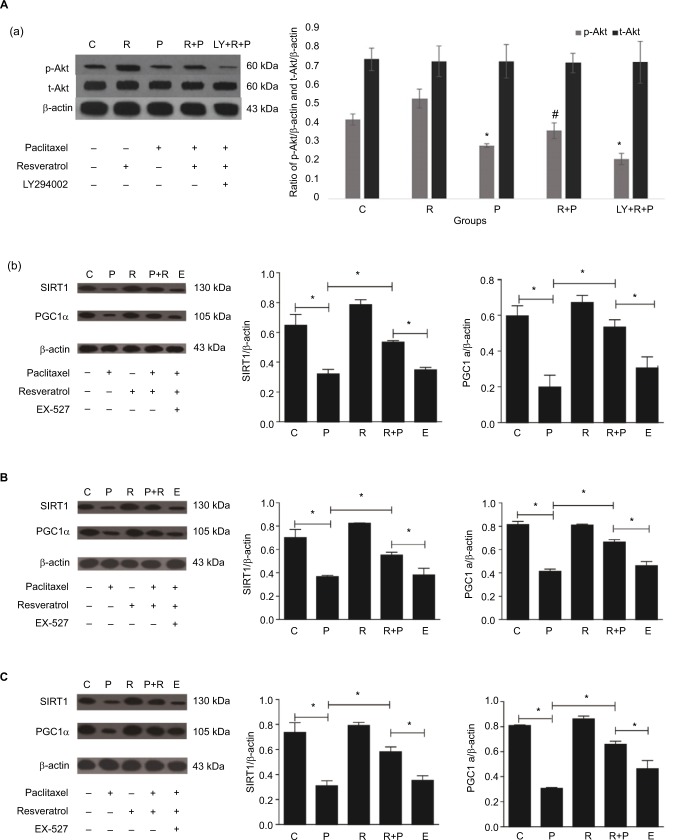
Figure 5.
Protein levels of t-Akt and p-Akt in corpus striatum (A-a). Three rats in each group. *P<0.05 compared to control animals, #P<0.05 compared to paclitaxel-treated rats. Protein levels of SIRT1 and PGC1α in corpus striatum (A, B). Protein levels of SIRT1and PGC1α in spinal dorsal horn (B). Protein levels of SIRT1and PGC1α in spinal dorsal horns (C). Protein levels of SIRT1and PGC1α in dorsal root ganglions (D). Paclitaxel reduced the expression levels of SIRT1 and PGC1α (*P<0.05), while resveratrol increased the expression of SIRT1 and PGC1α (*P<0.05); the protein levels of SIRT1 and PGC1α were suppressed by EX527 (*P<0.05).
Abbreviations: C, control group; R, resveratrol group; P, paclitaxel-treated group; R+P, resveratrol + paclitaxel-treated group; R+P+LY, pretreated-resveratrol + pretreated-paclitaxel + LY294002; E, pretreated-resveratrol + pretreated-paclitaxel + EX-527 group SIRT1, sirtuin 1.

