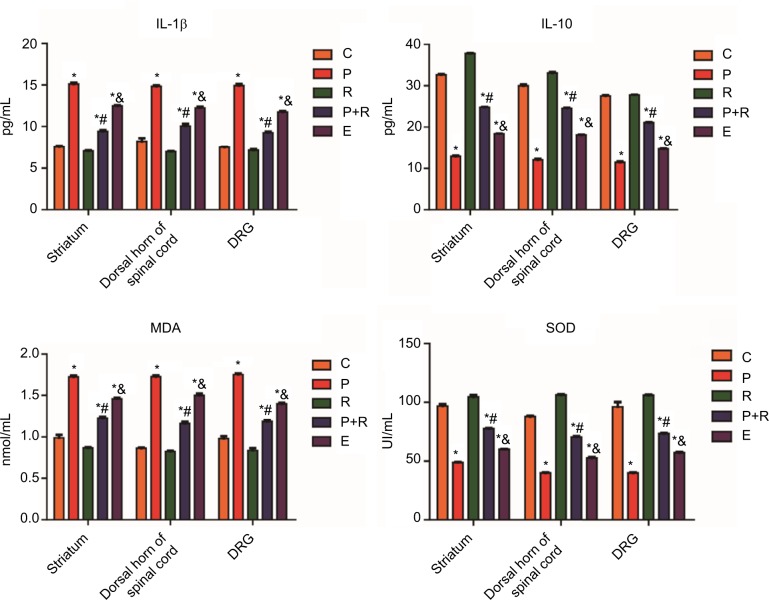
Figure 7.
The expression of IL-1β, IL-10, MDA, and SOD in the corpus striatum, SDH, and DRG tissues.
Notes: Five rats in each group. *P<0.05 compared to control animals, #P<0.05 compared to paclitaxel-treated rats, &P<0.05 compared to rats treated with paclitaxel with the pretreatment of resveratrol.
Abbreviations: C, control group; R, resveratrol group; P, paclitaxel-treated group; R+P, resveratrol + paclitaxel-treated group; DRG, dorsal root ganglions; MDA, malondialdehyde; SDH, spinal dorsal horns; SOD, superoxide dismutase.

