
Figure 5.
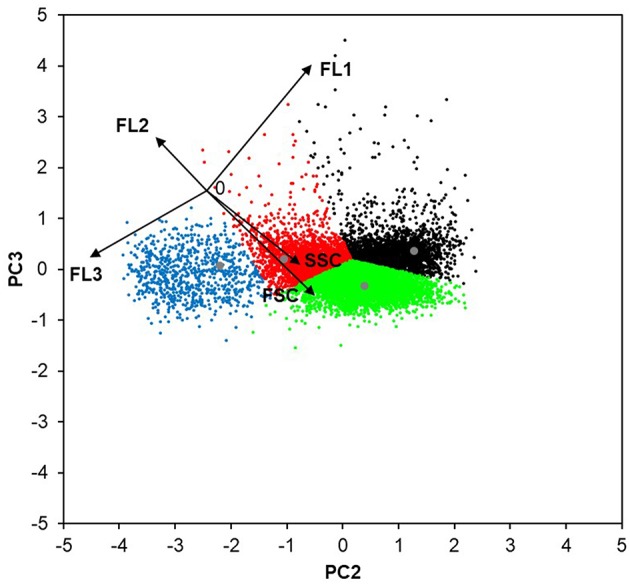
The four sub-populations of P. pastoris cells defined with the use of PCA. The flow cytometric data (FSC, SSC, FL1, FL2, FL3) of 10,000 random cells from the bioreactor cultivations of the strains producing EcPGA and CaLB, and the non-producing strain (all at μmethanol 0.016 h−1) were analyzed with PCA. The lowest level of redundancy was observed when the data were displayed as the combination of PC2 and PC3 (describing ~39.8% of the population variability), since the flow cytometric data (black vectors) were the most de-correlated. The length of each vector is 50 AU. The combination of PC3 and PC2 was used to establish the clustering method (population centers are displayed in gray). According to the FC signals (black arrows), the identified four clusters can be described as follows: smaller and less complex viable cells with no UPR up-regulation (red); larger and more complex viable cells with no UPR up-regulation (green); viable cells with up-regulated UPR (black); and cells with impaired viability (blue).