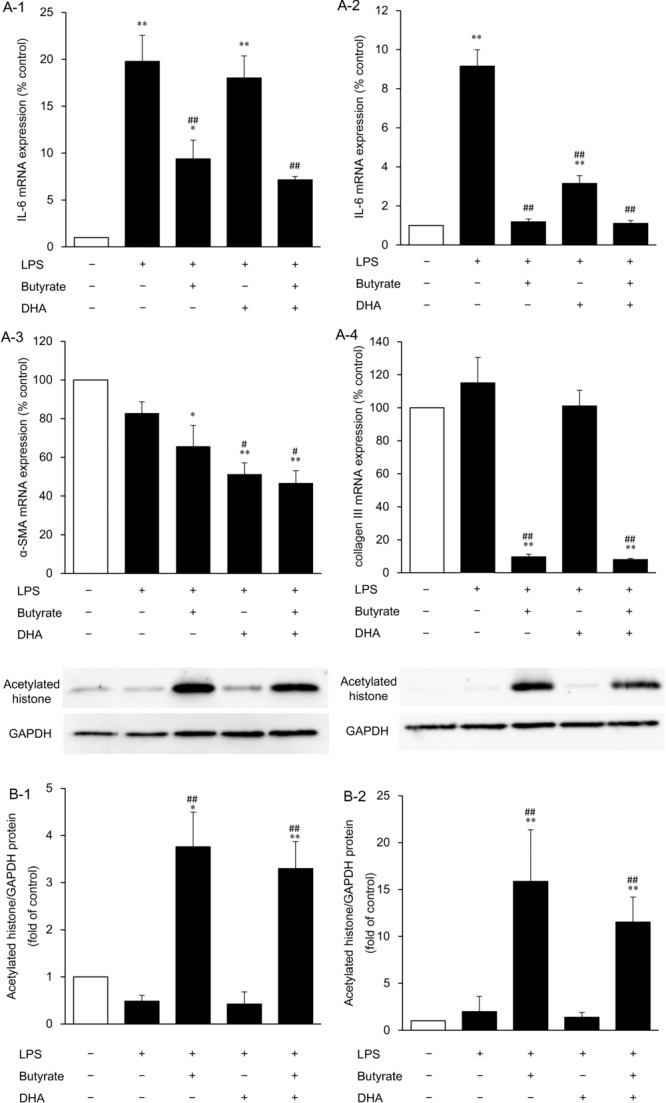
Figure 6.

The effects of butyrate, DHA, and combined administration of butyrate and DHA on IL-6 mRNA expression at 3 (a-1) and 48 hours (a-2), α-SMA (a-3), and collagen III (a-4) mRNA expression levels at 48 hours, and histone acetylation at 3 (b-1) and 48 hours (b-2) after addition of each fatty acid to the culture medium. HDFs were exposed to DHA (100 μM), butyrate (16 mM), or butyrate with DHA (16 mM and 100 μM, respectively) for 3 or 48 hours after LPS addition to the culture medium. Data from 3 independent experiments were used to calculate mean values and SEMs. *P < .05, **P < .01 as compared with control cultures; #P < .05, ##P < .01 in comparison with LPS alone (Tukey-Kramer post hoc test) (a). Acetylated histone protein was analyzed by Western blotting. A representative Western blot is shown at the top of each bar for each group and for the internal control. The graph presents the acetylated histone/GAPDH ratio. Data from 4 independent experiments were used to calculate mean values and SEMs. * P < .05, **P < .01 as compared with control cultures; ##P < .01 in comparison with LPS alone (Tukey-Kramer post hoc test) (b). DHA indicates docosahexaenoic acid; α-SMA, α-smooth muscle actin; HDF, human dermal fibroblast; and LPS, lipopolysaccharide.
