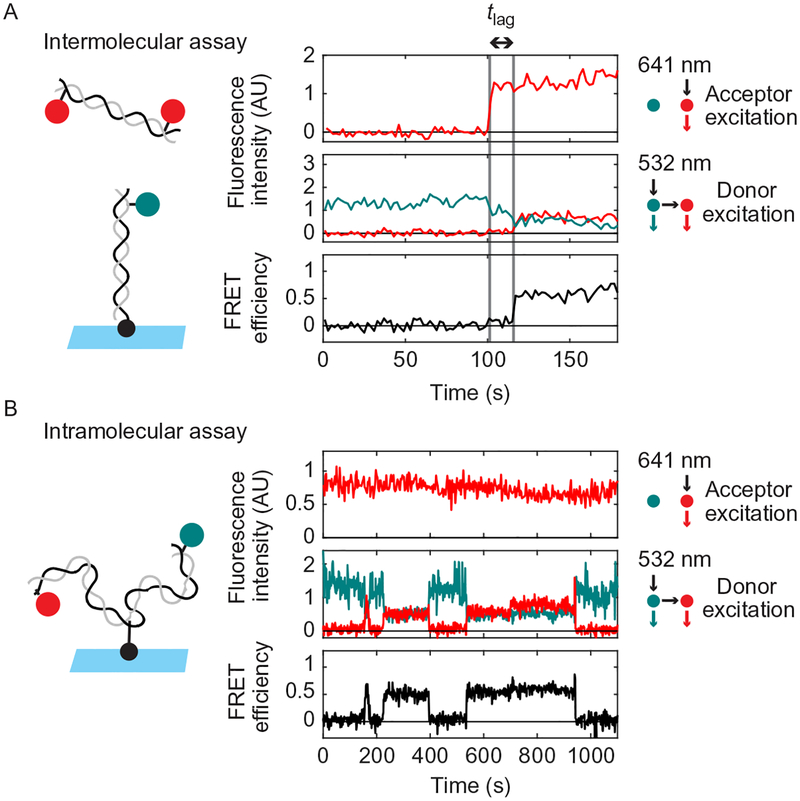
Fig. 7.
Example single-molecule traces from the intermolecular (A) and intramolecular (B) NHEJ assays. The upper panel in (A) and (B) shows Cy5 emission with direct excitation by 641nm light. The middle panel shows Cy3 and Cy5 emission with excitation of Cy3 by 532nm light. The lower panel shows calculated FRET efficiency. Substrate schematics are shown to the left. Note that 0s corresponds to the first frame in the particular field of view being imaged, not the time of extract addition. (A) In the intermolecular assay, binding of a Cy5-DNA to a Cy3-DNA on the surface is detected by appearance of Cy5 signal with 641nm excitation (first dashed gray line). Formation of the short-range synaptic complex is indicated by the appearance of a high-FRET signal (second dashed gray line) after a time delay (“tlag”). (B) A sample trace from the intramolecular assay showing three rounds of short-range complex formation and dissolution, as indicated by increases and decreases in FRET. This trace was acquired in extract immunodepleted of XRCC4-LIG4 and supplemented with catalytically inactive XRCC4-LIG4K278R complex, which supports short-range complex formation but not ligation.

