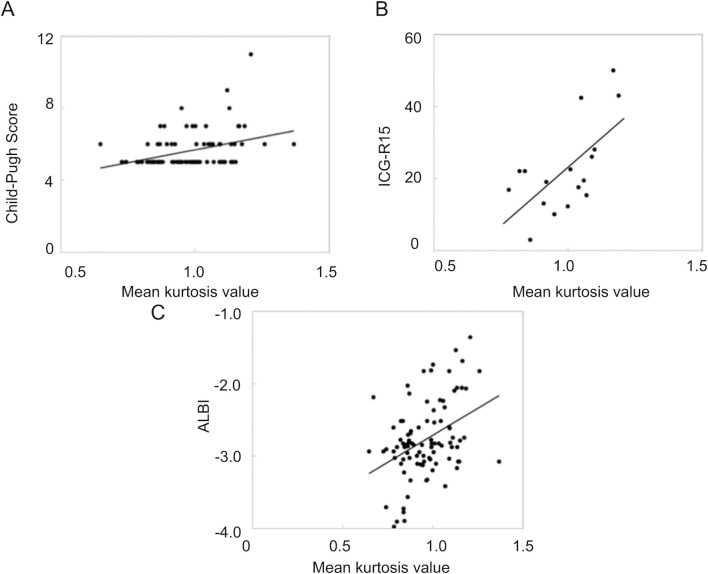
Figure 1.
Scatter plots of the correlation between the mean kurtosis value and three serum classification parameters. The correlation between the mean kurtosis value of liver parenchyma and (A) the Child–Pugh score, (B) the ICG-R15 value, and (C) the ALBI score is shown. ALBI, albumin–bilirubin; ICG, indocyanine green.

