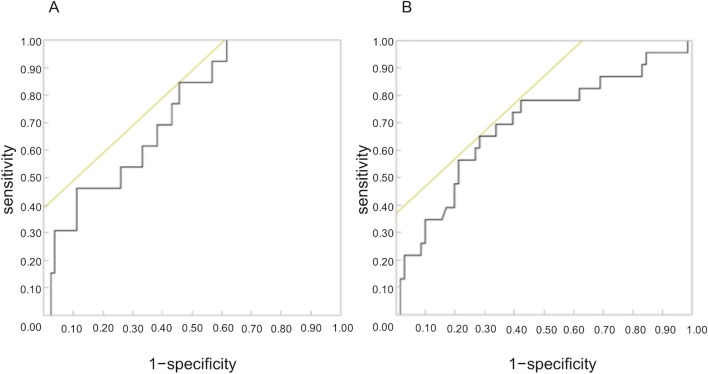
Figure 3.
(a) ROC curve and AUC analysis of the detection of differentiating Child–Pugh A from Child–Pugh B. (b) ROC curve and AUC analysis of the detection of differentiating ALBI Grade 1 from Grade 2–3. AUC, area under the ROC curve; ALBI, albumin–bilirubin; ROC, Receiver operating characteristic.

