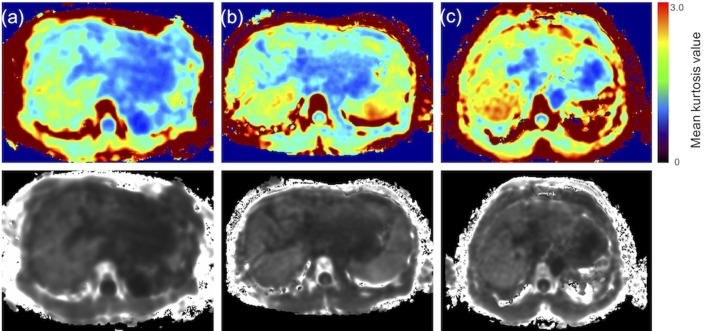
Figure 4.
Representative DKI maps of each class in the Child–Pugh classification. (a) Class A of the Child–Pugh classification (mean kurtosis value = 1.04), (b) Class B of the Child–Pugh classifications (mean kurtosis value = 1.14), and (c) Class C of the Child–Pugh classifications (mean kurtosis value = 1.19). The lower row of images presents the original DKI map. The upper row of images presents the color map used to make a visual assessment of the difference in values between organizations easier. The mean kurtosis value was defined as ranging from 0 to 3. DKI, diffusion kurtosis imaging.

