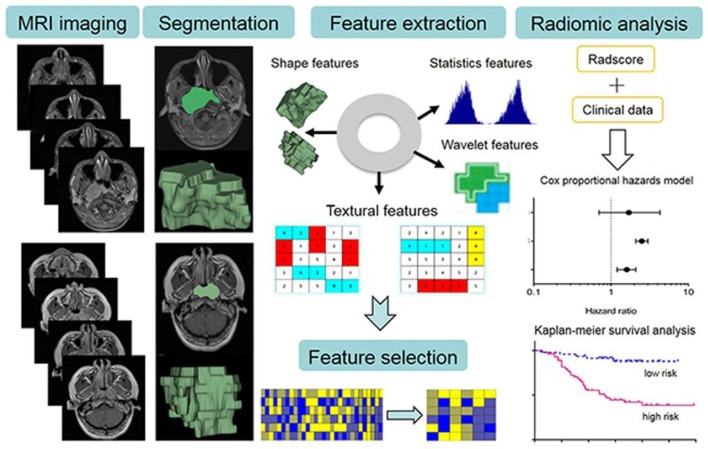
Figure 6.
Schema for the image post-processing on contrast-enhanced T1 and T2 images. The tumour areas were contoured on all MRI slices. Radiomics features are extracted that is correlative with clinical data for survival prediction. Adopted from Ouyang et al59 with open access source.

