Figure 4.

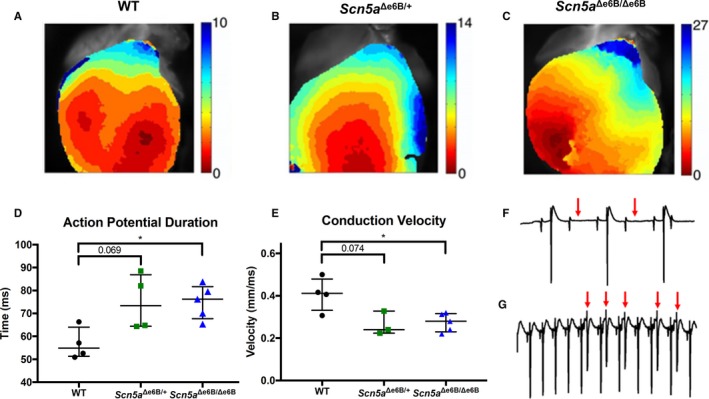
Optical mapping with programmed electrical stimulation ex vivo. Representative activation map from optical mapping in (A) wild‐type (WT), (B) Scn5a Δe6B/+ mice, and (C) Scn5a Δe6B/Δe6B mice, with color bar showing time from red to blue in milliseconds. D, Action potential duration in Scn5a Δe6B/Δe6B and Scn5a Δe6B/+ mice (P=0.028 and 0.069, respectively). E, Ventricular conduction velocity in Scn5a Δe6B/Δe6B and Scn5a Δe6B/+ mice (P=0.045 and 0.074, respectively). F, Representative tracing from ECG leads on hearts isolated ex vivo showing atrioventricular block (0/3 WT, 4/5 Scn5a Δe6B/Δe6B). Red arrows indicate the absence of a ventricular depolarization (large spikes) following atrial depolarization (small spikes). G, Representative tracing showing delayed afterdepolarizations (0/3 WT, 4/5 Scn5a Δe6B/Δe6B). Red arrows indicate ventricular afterdepolarizations. n=4 wild type, 4 Scn5a Δe6B/+, and 5 Scn5a Δe6B/Δe6B. *P<0.05.
