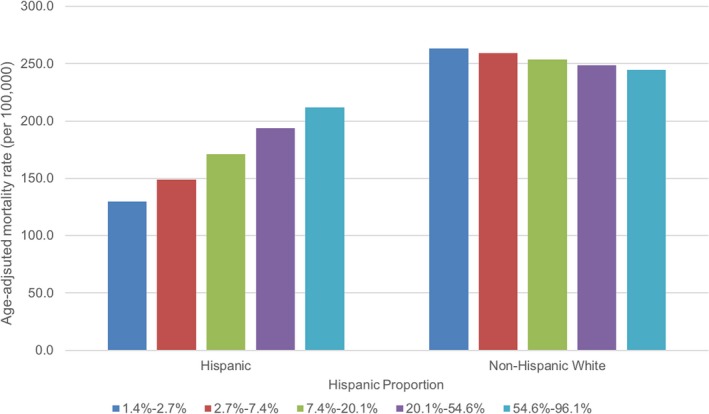
Figure 3.

Modeled estimates of age‐adjusted cardiovascular mortality rate (per 100 000) for Hispanics and non‐Hispanic whites by Hispanic proportion. The model estimates include midpoint values of Hispanic density on log scale (1.9% for category 1, 4.5% for category 2, 12.2% for category 3, 33.1 for category 4, and 73.7 for category 5) and mean values were used for other covariates (population size, proportion female, median household income, % under poverty line, % high school graduation, % some college, % unemployed, % black, % not proficient in English and % rural, % uninsured and primary care physician rate).
