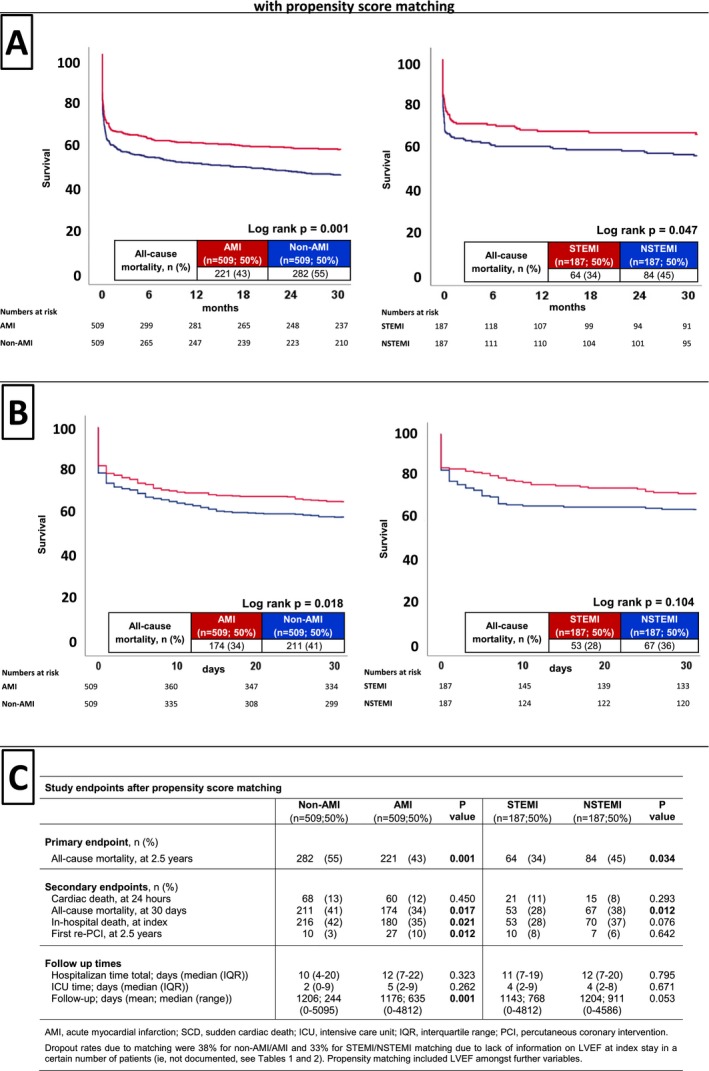
Figure 2.

After propensity score matching, Kaplan–Meier survival curves still demonstrated the association of non‐AMI (left) and NSTEMI (right) patients with the primary end point of long‐term all‐cause mortality at 2.5 years (A) and the secondary end point of all‐cause mortality at 30 days (B). C, Distribution of the primary and secondary end points after propensity score matching. NSTEMI indicates non–ST‐segment–elevation myocardial infarction; AMI, acute myocardial infarction; ICU, intensive care unit; IQR, interquartile range; LVEF, left ventricular ejection fraction; PCI, percutaneous coronary intervention; STEMI, ST‐segment–elevation myocardial infarction.
