
Figure 2.
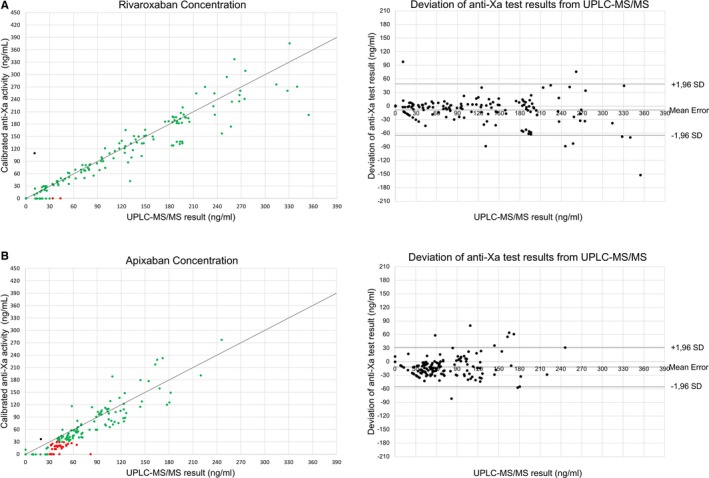
Diagnostic accuracy of anti‐Xa activity testing. Left: Scatter plots showing the correlation of FXa inhibitor concentrations (A, rivaroxaban; B, apixaban) determined by UPLC‐MS/MS, criterion standard and calibrated anti‐Xa activity testing. Green dots represent samples correctly identified as below or above the safe‐for‐treatment threshold of 30 ng/mL (true‐negative and true‐positive results). Red dots represent samples incorrectly identified as below the safe‐for‐treatment threshold (false negative). Orange dots represent samples incorrectly identified as above the safe‐for‐treatment threshold (false positive). Right: Bland‐Altman blot of UPLC‐MS/MS and anti‐Xa activity results showing the mean measurement error and SD of test results. UPLC‐MS/MS indicates ultraperformance liquid chromatography–tandem mass spectrometry.