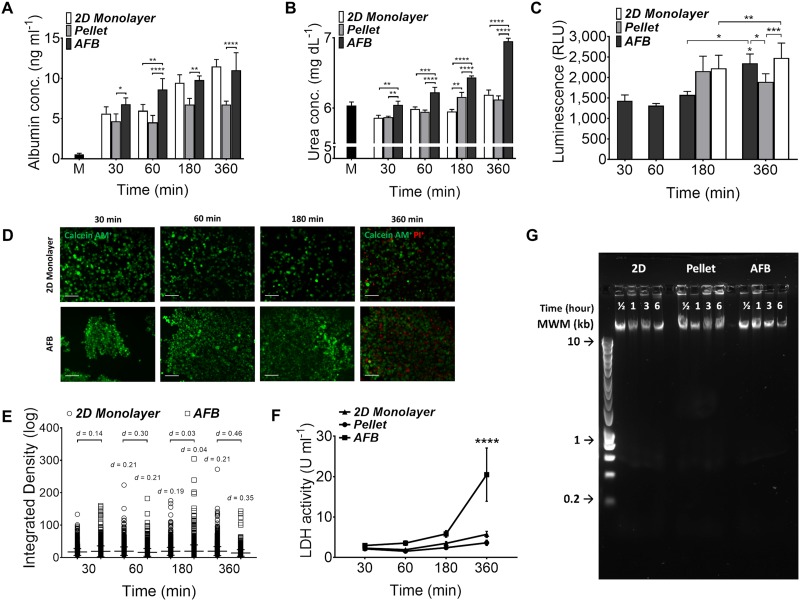
FIG. 5.
Functions of Huh7 in the AFB. (a) Albumin concentrations (ng ml−1) and (b) urea concentrations (mg dl−1) in supernatants from Huh7 cultured in the 2D monolayer, pellet, or AFB cultures with time course. n = 3. P values shown in the graph are for comparison to cells after 30 min between various cultures. M, medium. (c) CYP3A4 activity in Huh7 cultured in the AFB system with time course and following 3 and 6 h as the 2D monolayer or pellet cultures. n = 3. P values shown in the graph are for comparison to cells after 30 min in AFB or between various cultures. *P < 0.05, ***P < 0.0005, ****P < 0.0001. Mean ± SEM. Paired Student t test. (d) Permeability of Huh7 with time course in AFB compared to the 2D monolayer culture with time course. Cells were preloaded with calcein AM (1 μM), scale = 100 μm and (e) quantification of change in cell fluorescence over time course, expressed as integrated density. Difference between means tested by Cohen’s d effect size values were marked. Mean ± SD. d = 0.2 (small) and d = 0.5 (medium). (f) Lactic dehydrogenase (LDH) activity (U ml−1) in supernatants from Huh7 cultures with time course. n = 3. P values shown in the graph are for comparison between various cultures with time course (on top of bars). ****P < 0.0001. Mean ± SEM. Two-way ANOVA followed by Fisher’s LSD test. (G) DNA fragmentation assay of Huh7 DNA loaded in 1% agarose gel with different culture systems and time (representative image of 3 experiments). HyperLadder™ 1 kb molecular weight marker (MWM) was indicated.

