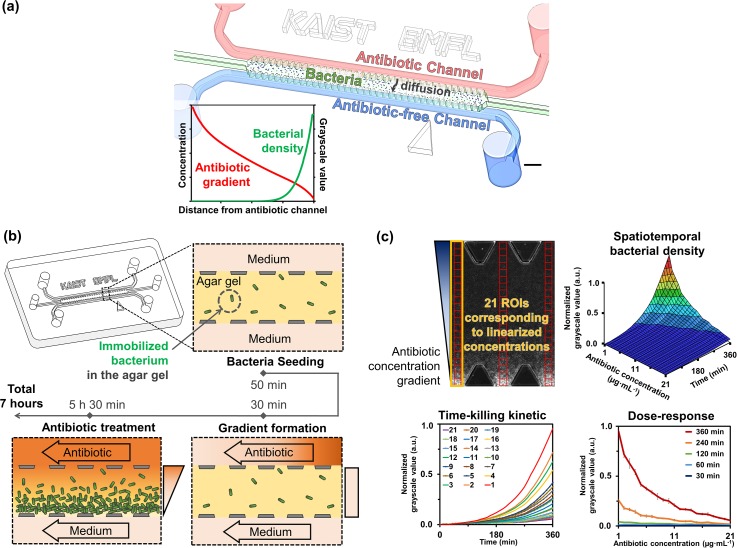
FIG. 1.
Schematic for the process of on-chip antibiotic treatments and image analysis. (a) The representative schematic for our AST chip. Scale bar is 1.2 mm. (b) Experimental process of the chip AST as shown where a mixture of bacterial sample and agar gel is introduced into the microfluidic channel. Then, the antibiotic concentration gradient is formed within 30 min and changes in local bacterial growth are observed due to treatment under antibiotic gradient. (c) Image analysis and quantification. GSVs are acquired from the ROIs corresponding to linearized concentrations, and the 3D diagram of normalized GSVs can be shown along linearized antibiotic concentrations over 6 h of treatment time. From the diagram, time-killing kinetic and the dose-response graphs can be reconstructed. The length of one side of the ROI is 60 μm.

