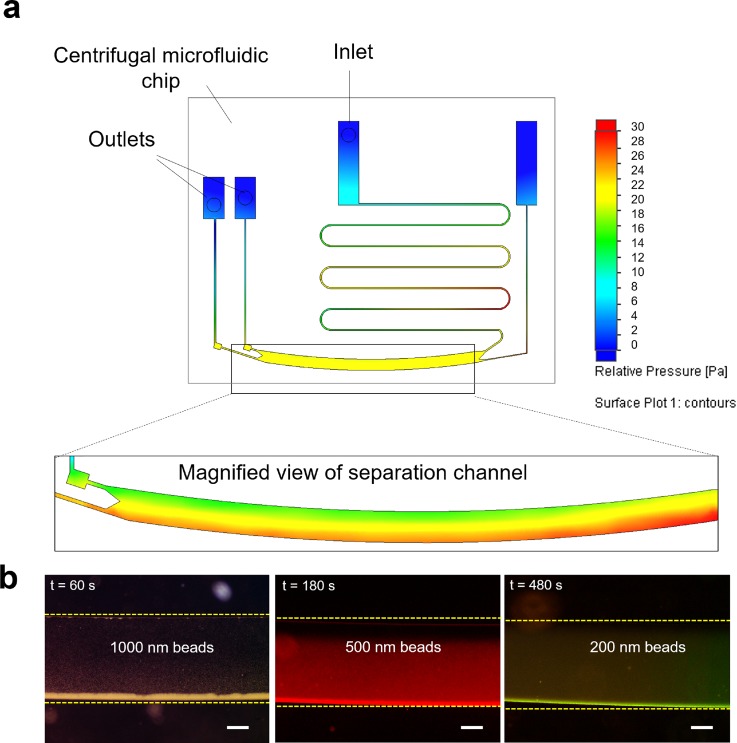
FIG. 2.
Separation of monodispersed nanoparticles. (a) Simulation of the microfluidic chip upon centrifugation. Color denotes the pressure difference within the microchannels. The inset shows the magnified view of the separation channel. (b) Separation of nanoparticles of reducing sizes (i.e., d = 1000, 500, and 200 nm) observed with the microfluidic chip of reducing channel heights (i.e., h = 100, 50, and 25 μm) respectively. The dotted line indicates the position of the channel wall. The scale bar represents 200 μm.

