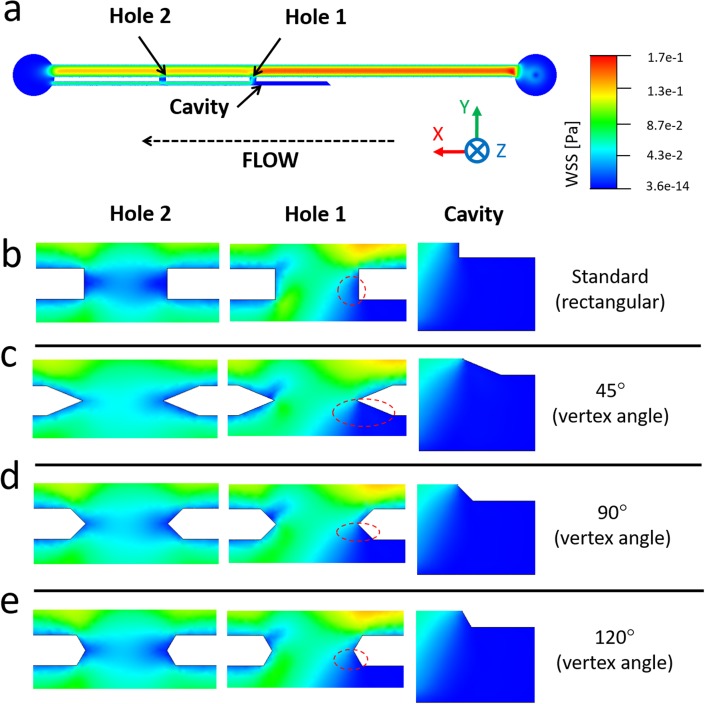
FIG. 10.
(a) Contours of WSS magnitude at the bottom plane of the SoC model, computed numerically. (b) Contours of WSS are reported at three hydrodynamic regions within the model (Hole 1, Hole 2, and Cavity), at an inlet flow rate of 1 ml/min and vertex angles of (c) 45°, (d) 90°, and (e) 120°. Red dashed circular/oval boxes indicate stagnant regions with low-WSS, located in proximity to Hole 1 and facing the extra-luminal compartment of the model.

