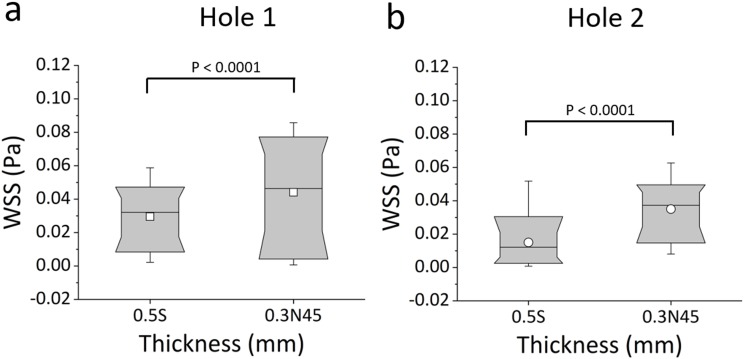
FIG. 11.
Box plots showing the distribution of WSS values (in Pa) over (a) Hole 1 and (b) Hole 2 of the SoC models. Values were computed numerically at an inlet flow rate of 1 ml/min, for both the standard stent design (referred to as 0.5S) and the new design (referred to as 0.3N45). Box plots show the distribution of WSS over the ranges of 10%, 25%, 50%, 75%, and 90% of the total distribution. Empty squares correspond to the mean values. The statistical significance was determined using the KS-test, and P-values are reported above the box plots for statistically relevant comparisons.

