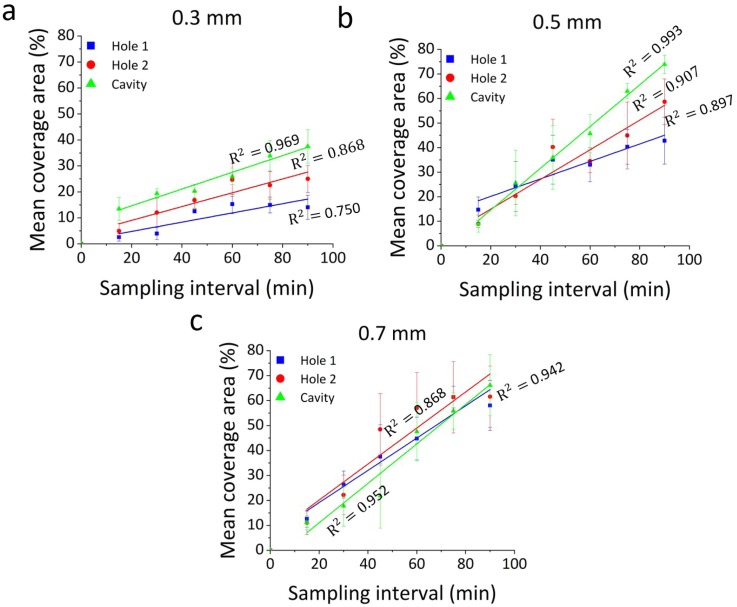
FIG. 7.
Time evolution of the percentage area covered by encrusting deposits, at specific regions of interest within the models (Hole 1, Hole 2, and Cavity). Results are reported for inlet flow rate of 1 ml/min, and at three wall thicknesses of (a) 0.3 mm, (b) 0.5 mm, and (c) 0.7 mm. Data are expressed as mean value ± standard deviation of three independent repeats. Linear regression functions (for the time interval: 15 min–90 min) are plotted, together with the corresponding R2 values.

